by Don Vialoux, Timingthemarket.ca
The Bottom Line
Technical evidence shows that world equity markets are intermediate overbought and showing early signs of rolling over. Preferred strategy is to hold seasonally attractive equity positions that remain in an intermediate uptrend and continue to outperform the S&P 500 Index. Profit taking in other positions is appropriate.
Economic News This Week
December ISM Index to be released at 10:00 AM EST on Tuesday is expected to slip to 53.2 from 53.6 in November.
FOMC Meeting Minutes from December 13-14th meeting are to be released at 2:00 PM EST on Wednesday.
December Private Employment ADP report to be released at 8:15 AM EST on Thursday is expected to show 170,000 gains versus 216,000 gains in November.
Weekly Initial Jobless Claims to be released at 8:30 AM EST on Thursday are expected to remain unchanged from the previous week at 265,000.
December ISM Services Index to be released at 10:00 AM EST on Thursday is expected to slip to 56.6 from 57.2 in November.
December Non-farm Payrolls to be released at 8:30 AM EST on Friday are expected to slip to 175,000 from 178,000 in November. Private Non-farm Payrolls are expected to increase to 170,000 from 156,000 in November. December Unemployment Rate is expected to increase to 4.7% from 4.6% in November. December Hourly Earnings are expected to increase 0.3% versus a decline of 0.1% in November.
November U.S. Trade Deficit to be released at 8:30 AM EST on Friday is expected to ease to $42.2 billion from $42.6 billion in October.
Canadian December Employment to be released at 8:30 AM EST on Friday is expected to be unchanged versus a gain of 10,700 in November. December Unemployment Rate is expected to increase to 6.9% from 6.8% in November
Canadian November Merchandise Trade Deficit to be released at 8:30 AM EST on Friday is expected to increase to $1.4 billion from $1.3 billion in October
November Factory Orders to be released at 10:00 AM EST on Friday are expected to drop 2.1% versus a gain of 2.7% in October.
Earnings News This Week
Thursday: Constellation Brands, Monsanto, Walgreens
Observations
Technical action last week was quiet in typical Christmas/New Year’s trade. Eight S&P 500 stocks broke intermediate resistance and 12 stocks broke intermediate support (including 7 stocks on Friday). Number of stocks in an uptrend slipped to 312 from 317, number of stocks in a neutral trend increased to 73 from 72 and number of stocks in a downtrend increased to 115 to 111. The Up/Down ratio slipped from 2.86 to (312/115=) 2.71
Economic focuses this week is on the ISM report on Tuesday and the Non-farm Payroll report on Friday. Generally, news this year will dampen enthusiasm for continuing economic strength in the U.S. Economic news in Canada also is expected to dampen enthusiasm for continuing economic growth.
The limited number of U.S. earnings reports this week is not expected to have a significant impact on equity markets. Consensus continues to call for fourth quarter gains by S&P 500 companies on a year-over-year rate of 3.2% in earnings and 5.2% in revenues. Seventy seven companies have issued negative guidance and 34 companies have issued positive guidance for the quarter. Consensus calls for an increase in fourth quarter earnings by Dow Jones Industrial Average companies on average (median) by only 1.1%. Watch for more negative earnings warnings by multi-national U.S. companies this week and next week primarily triggered by strength in the U.S. Dollar Index in the fourth quarter.
Intermediate technical indicators for U.S. equity markets and sectors generally are overbought and trending down. In retrospect, the S&P 500 Index reached an intermediate peak two weeks ago on December 21st
Short term momentum indicators by U.S. equity indices and economic sensitive sectors (e.g. short term momentum indicators, trades above/below 20 day moving average) deteriorated significantly last week.
Historically, the first week in January has recorded higher equity market indices due to a series of recurring events including new money entering pension plans, investment of year- end bonuses by individuals, encouraging broker reports about prospects for the following year, etc. However, this year is different for several reasons: Investors anticipating a lower tax rate in 2017 has deferred equity sales to this week, balanced mutual and pension funds with an obligation to rebalance at the end of the quarter/year end will be sellers of equities and buyers of fixed income securities (the spread between equity weights and fixed income weights was skewed greater than average in the fourth quarter of 2016). Buying of stocks subject to a recovery after tax loss selling pressures is less acute this year because most equity sectors closed at or near their highs at the end of 2016 (exception: precious metal equities).
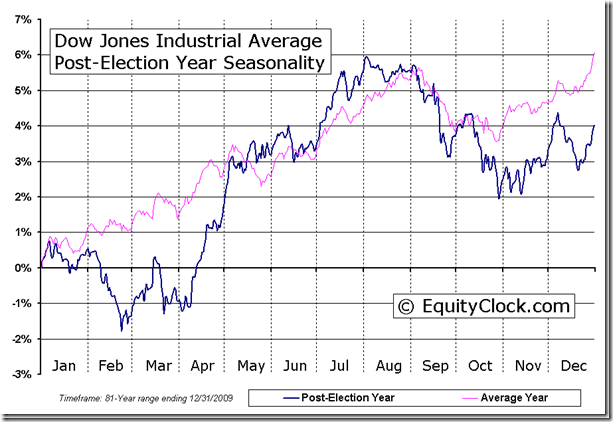
Historically, U.S. equity markets have struggled from January to April during Post Presidential election years, particularly when a new Republican President and a Republican Congress introduce their political agenda.
In contrast, intermediate technical indicators for the TSX continue to trend higher, but also are at intermediate overbought levels.
Commodity prices continue to outperform equity market indices, typical at this time of year until late February. Not surprising, the TSX Composite Index has started to outperform U.S. equity indices. Look for this trend to continue in anticipation of strong fourth quarter earnings by TSX 60 companies on a year-over-year basis led by commodity sensitive equities, notably energy and base metal companies. Consensus shows an average (median) gain by TSX 60 companies of 8.3% in the fourth quarter with even stronger gains expected in the first quarter of 2017.
Seasonality for equity markets and many sectors has a history of turning from positive to at least neutral and frequently negative from early January to early February. See changes in seasonality indicated below:
Equity Indices and Related ETFs
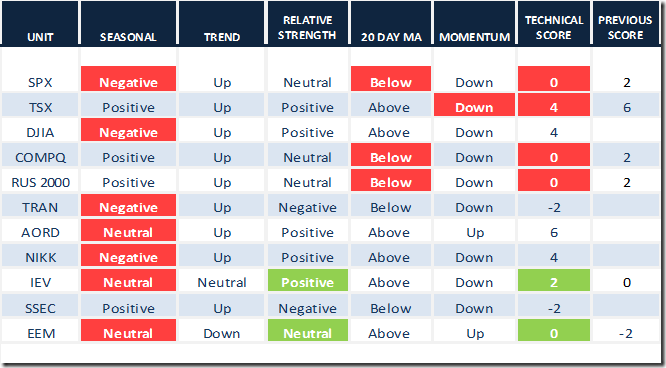
Daily Seasonal/Technical Equity Trends for December 30th 2016
Green: Increase from previous day
Red: Decrease from previous day
Calculating Technical Scores
Technical scores are calculated as follows:
Intermediate Uptrend based on at least 20 trading days: Score 2
Higher highs and higher lows
Intermediate Neutral trend: Score 0
Not up or down
Intermediate Downtrend: Score -2
Lower highs and lower lows
Outperformance relative to the S&P 500 Index: Score: 2
Neutral Performance relative to the S&P 500 Index: 0
Underperformance relative to the S&P 500 Index: Score –2
Above 20 day moving average: Score 1
At 20 day moving average: Score: 0
Below 20 day moving average: –1
Up trending momentum indicators (Daily Stochastics, RSI and MACD): 1
Mixed momentum indicators: 0
Down trending momentum indicators: –1
Technical scores range from -6 to +6. Technical buy signals based on the above guidelines start when a security advances to at least 0.0, but preferably 2.0 or higher. Technical sell/short signals start when a security descends to 0, but preferably -2.0 or lower.
Long positions require maintaining a technical score of -2.0 or higher. Conversely, a short position requires maintaining a technical score of +2.0 or lower.
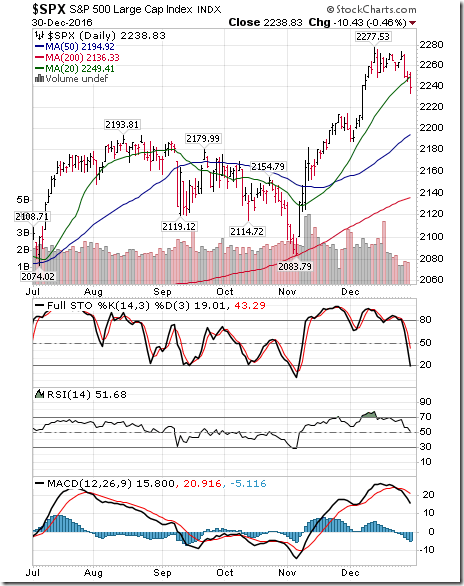
S&P 500 Index dropped 24.96 points (1.10%) last week. The Index reached an intermediate peak on Wednesday December 21st. Intermediate trend remains up. The Index dropped below its 20 day moving average on Friday. Short term momentum indicators are trending down.
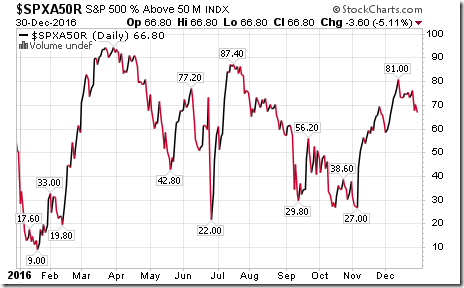
Percent of S&P 500 stocks trading above their 50 day moving average (Also known as the S&P 500 Momentum Barometer) plunged last week to 66.80 from 74.40. Percent remains intermediate overbought and showing signs of rolling over from a peak set on December 21st
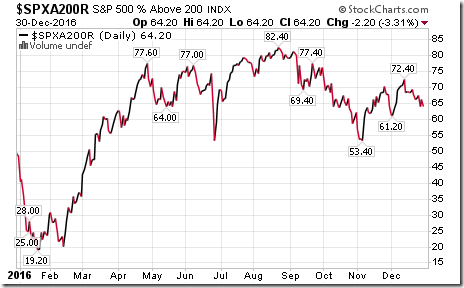
Percent of S&P 500 stocks trading above their 200 day moving average slipped last week to 64.20 from 67.00. Percent remains intermediate overbought and showing signs of rolling over from a peak set on December 21st
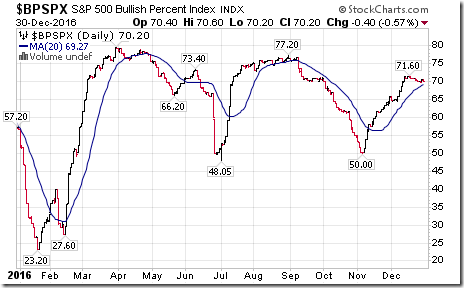
Bullish Percent Index for S&P 500 stocks increased last week to 70.20 from 70.00 and remained above its 20 day moving average. The Index remains intermediate overbought.
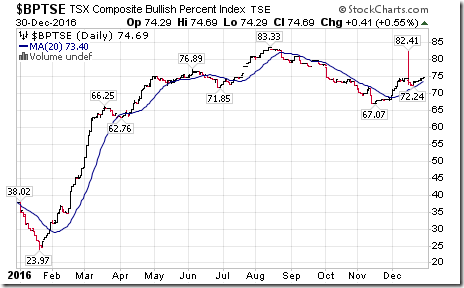
Bullish Percent Index for TSX Composite stocks increased last week to 74.69 from 73.88 and remained above its 20 day moving average. The Index remains intermediate overbought.
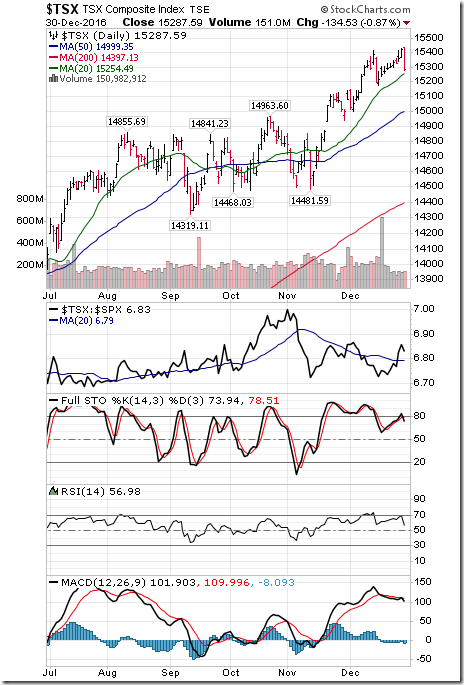
The TSX Composite Index slipped 40.56 points (0.26%) last week. Intermediate trend remains up (Score: 2). Strength relative to the S&P 500 Index changed last week to positive from negative.(Score: 2). The Index remains above its 20 day moving average (Score: 1). Short term momentum indicators turned down on Friday (Score: -1).
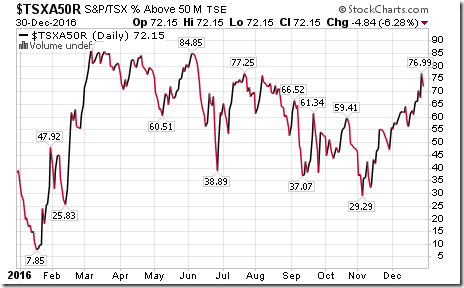
Percent of TSX stocks trading above their 50 day moving average (also known as the TSX Momentum Barometer) increased last week to 72.15 from 70.42. The Index remains intermediate overbought, but has yet to show significant signs of peaking.
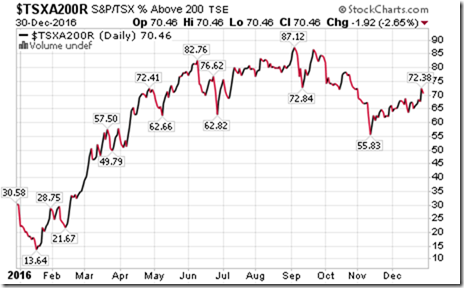
Percent of TSX stocks trading above its 200 day moving average increased last week to 70.46 from 68.33. Percent remains intermediate overbought, but has yet to show significant signs of peaking.
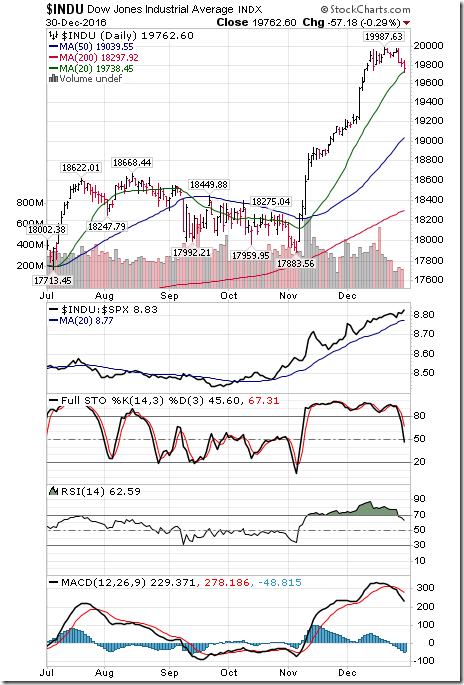
The Dow Jones Industrial Average dropped 171.21 points (0.86%) last week. Intermediate trend remains up. Strength relative to the S&P 500 Index remains positive. The Average remains above its 20 day moving average. Short term momentum indicators have turned down. Technical score dipped last week to 4 from 6.
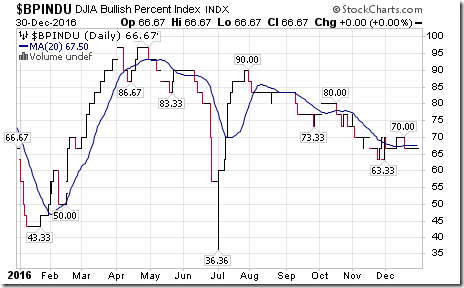
Bullish Percent Index for Dow Jones Industrial Average stocks was unchanged last week at 66.67% and remained below its 20 day moving average. The Index remains intermediate overbought.
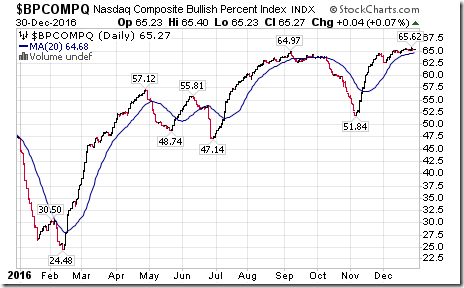
Bullish Percent Index for NASDAQ Composite stocks inched up to 65.27 from 65.06 last week and remains above its 20 day moving average. The Index remains intermediate overbought.
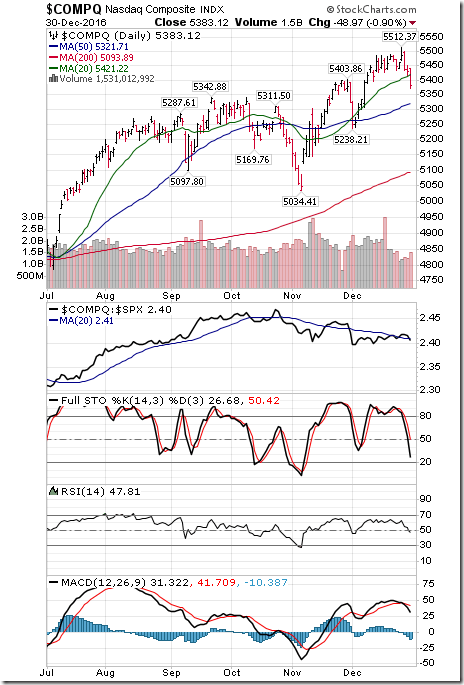
The NASDAQ Composite Index dropped 79.57 points (1.46%) last week. Intermediate trend remains up. Strength relative to the S&P 500 Index remained neutral. The Index dropped below its 20 day moving average on Friday. Short term momentum indicators are turned down. Technical score slipped last week to 0 from 4.
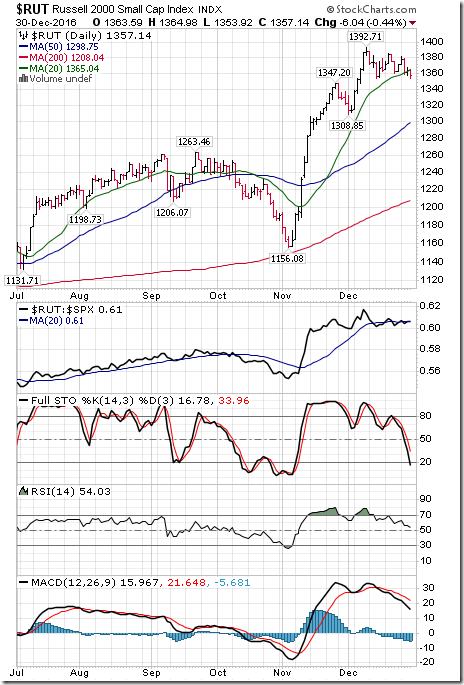
The Russell 2000 Index dropped 14.37 points (1.05%) last week. Intermediate trend remains up. Strength relative to the S&P 500 Index remained Neutral. The Index dropped below its 20 day moving average on Friday. Short term momentum indicators are trending down. Technical score slipped last week to 0 from 2.
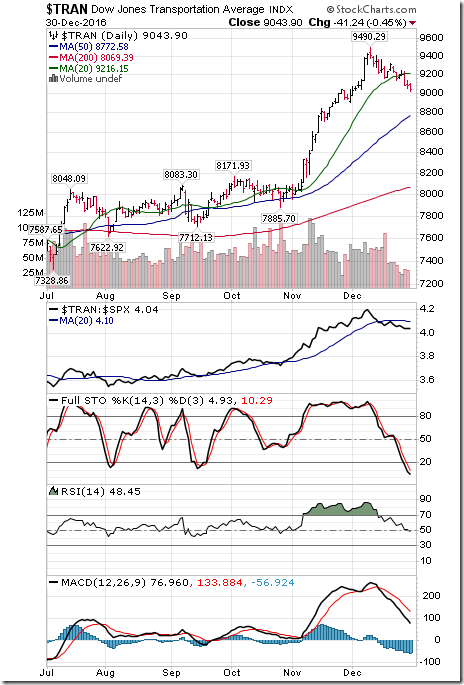
Dow Jones Transportation Average dropped another 146.74 points (1.60%) last week. Intermediate trend remains up. Strength relative to the S&P 500 Index remained negative. The Average remained below its 20 day moving average. Short term momentum indicators continued to trend down. Technical score remained last week at -2.
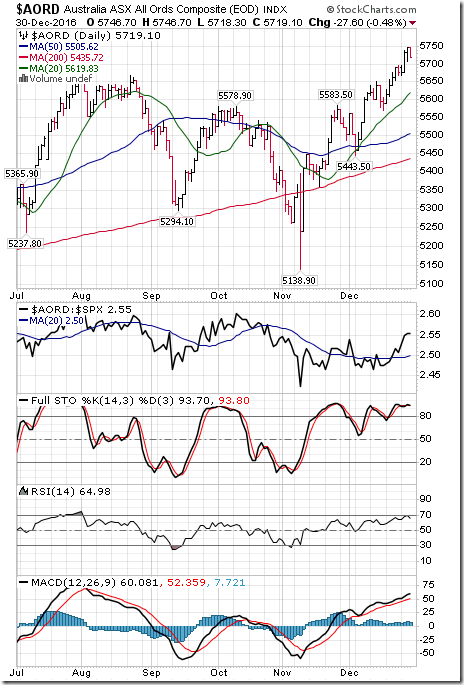
The Australia All Ordinaries Index added 44.00 points (0.78%) last week. Intermediate trend remains up. Strength relative to the S&P 500 Index changed to positive from neutral. The Index remains above its 20 day moving average. Short term momentum indicators are trending up. Technical score increased last week to 6 from 4.
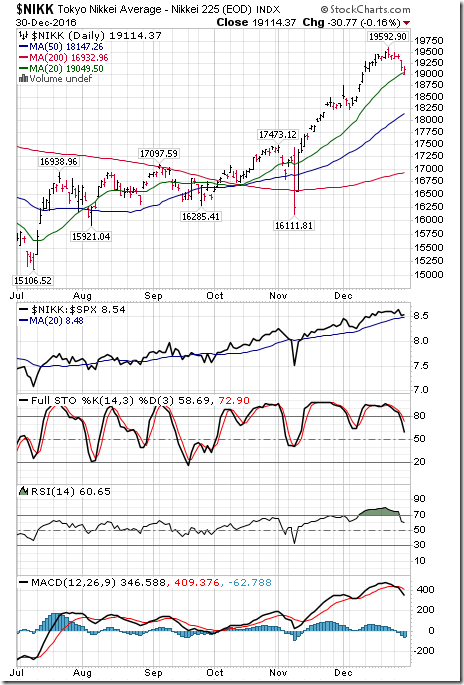
The Nikkei Average dropped 313.30 points (1.61%) last week. Intermediate trend remains up. Strength relative to the S&P 500 Index remains positive. The Average remains above its 20 day moving average. Short term momentum indicators have turned down. Technical score slipped last week to 4 from 6.
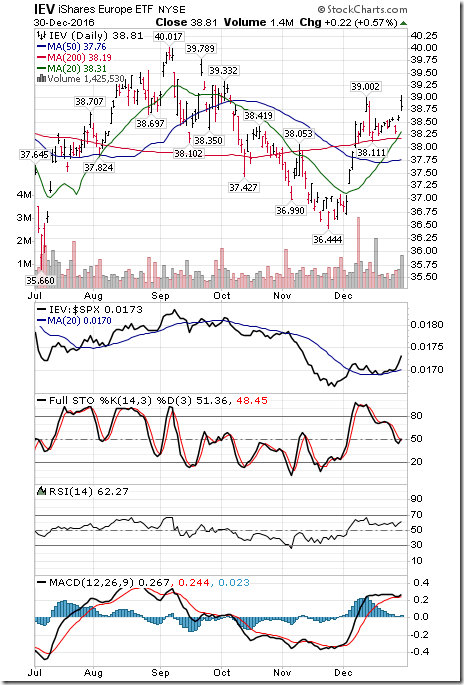
Europe iShares added $0.30 (0.78%) last week. Intermediate trend remains neutral. Strength relative to the S&P 500 Index turned positive from neutral. Units remained above their 20 day moving average. Short term momentum indicators are trending down. Technical score increased last week to 2 from 0.
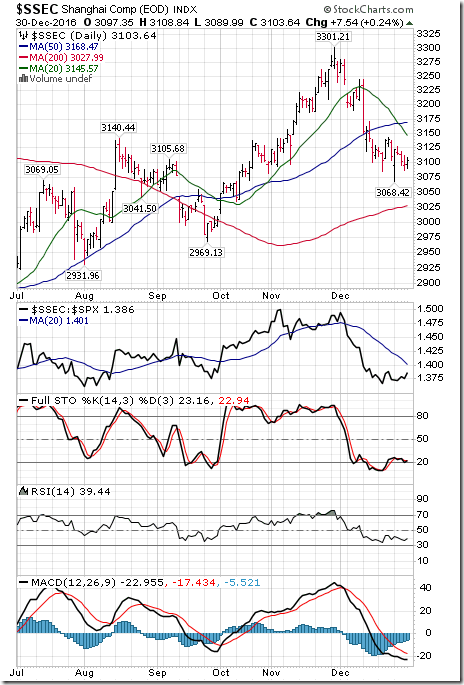
The Shanghai Composite Index added 6.51 points (0.21%) last week. Intermediate trend remains up. Strength relative to the S&P 500 Index remained negative. The Index remained below its 20 day moving average. Short term momentum indicators are trending down. Technical score remained last week at -2.
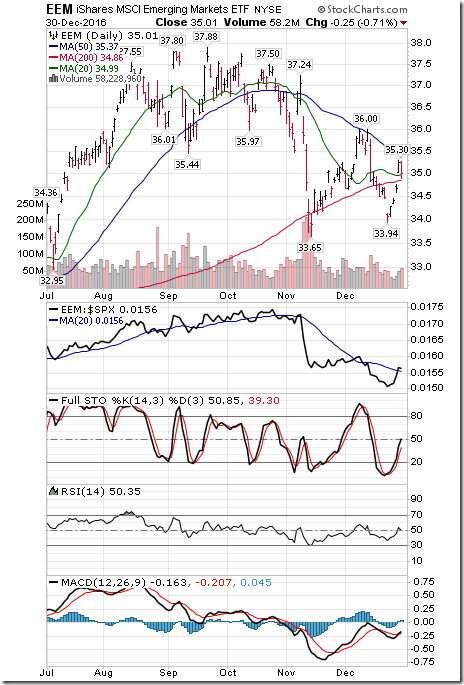
Emerging Markets iShares added $0.73 (2.13%) last week. Intermediate trend remains down. Strength relative to the S&P 500 Index changed to Neutral from Negative. Units moved above their 20 day moving average. Short term momentum indicators have turned up. Technical score improved last week to 0 from -6.
Currencies
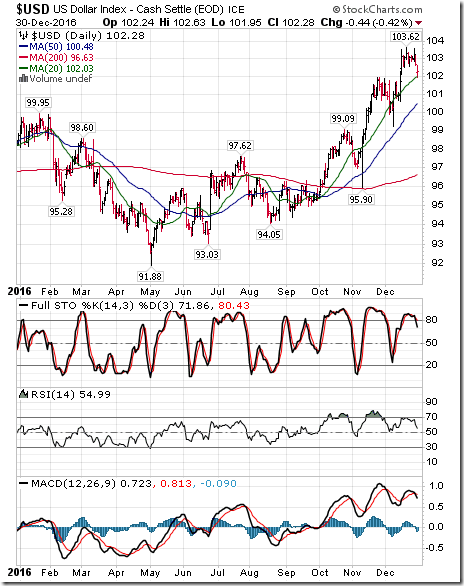
The U.S. Dollar Index dropped 0.72 (0.70%) last week. Intermediate trend remains up. The Index remains above its 20 day moving average. Short term momentum indicators have rolled over.
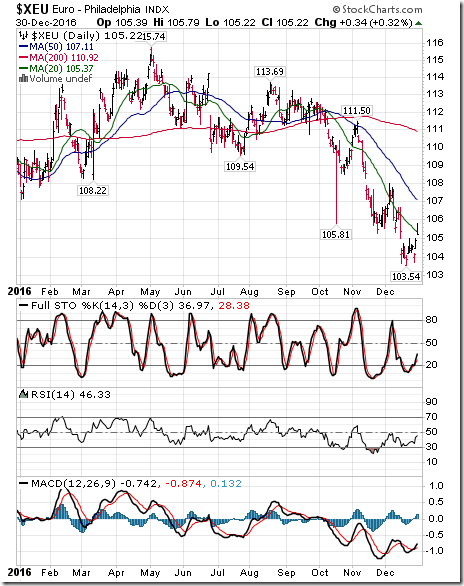
The Euro gained 0.66 (0.69%) last week. Intermediate trend remains down. The Euro remains below its 20 day moving average. Short term momentum indicators have turned up.
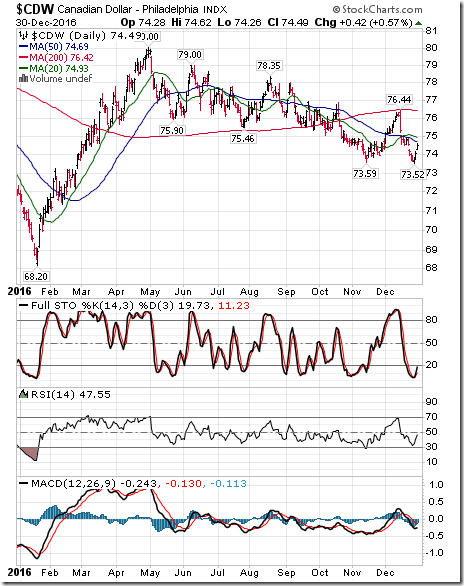
The Canadian Dollar gained U.S. 0.60 cents (0.81%) last week. Intermediate trend remains down. The Canuck Buck remains below its 20 day moving average. Short term momentum indicators have just turned higher.
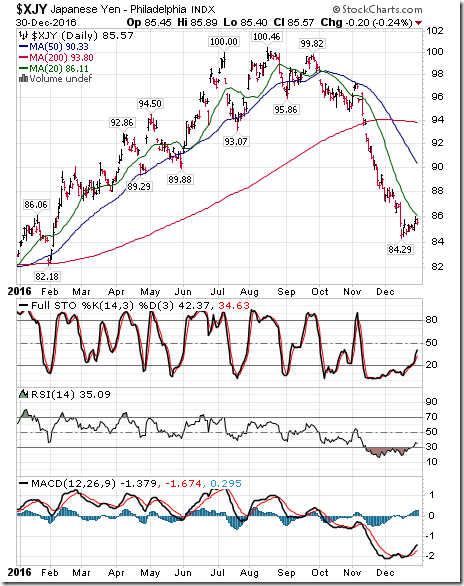
The Japanese Yen added 0.29 (0.34%) last week. Intermediate trend remains down. The Yen remains below its 20 day moving average. Short term momentum indicators have turned up.
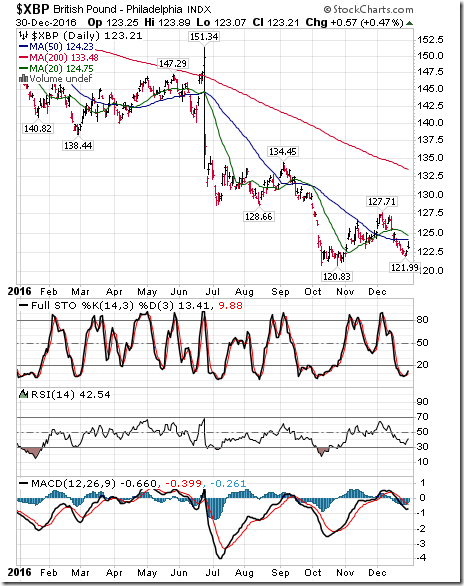
The British Pound gained 0.42 90.34%) last week. Intermediate trend remains neutral. The Pound remained below its 20 day moving average. Short term momentum indicators have just turned up.
Commodities
Daily Seasonal/Technical Commodities Trends for December 30th 2016
Green: Increase from previous day
Red: Decrease from previous day
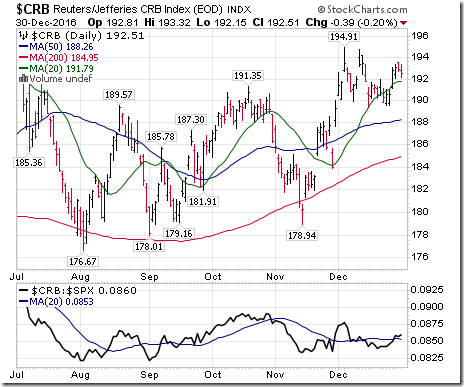
The CRB Index added 2.01 points (1.05%) last week. Intermediate trend remains up. Strength relative to the S&P 500 Index remains up. Strength relative to the S&P 500 Index remains neutral. The Index remains above its 20 day moving average. Short term momentum indicators are trending up. Technical score improved last week to 4 from 2.
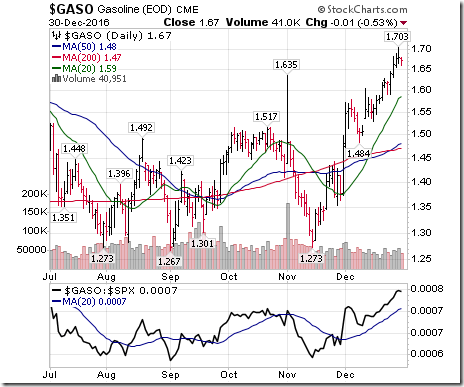
Gasoline gained $0.03 per gallon (1.83%) last week. Intermediate trend remains up. Strength relative to the S&P 500 Index remains up. Gas remains above its 20 day moving average. Short term momentum indicators are trending up. Technical score remained last week at 6.
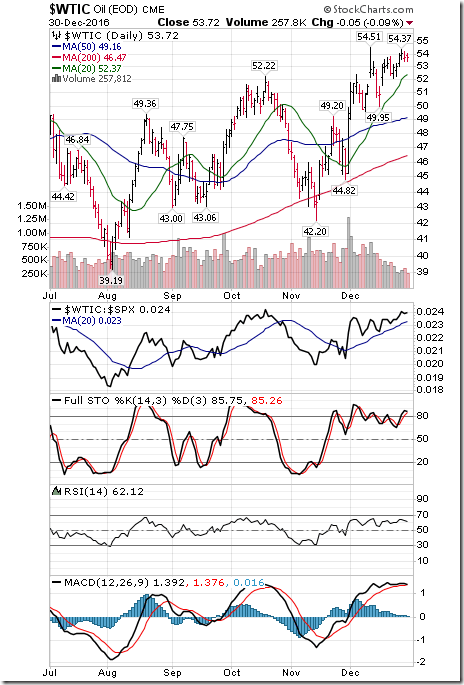
Crude Oil added $0.70 per barrel (1.32%) last week. Intermediate trend remains up. Strength relative to the S&P 500 Index remains positive. Crude remains above its 20 day moving average. Short term momentum indicators are trending down. Technical score remained at 4.
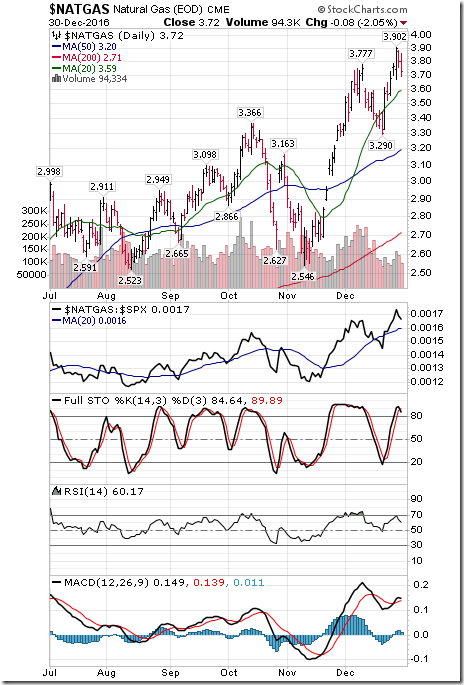
Natural gas gained added $0.04 per MBtu (1.09%) last week. Intermediate trend remains up. Strength relative to the S&P 500 Index remains positive. “Natty” remains above its 20 day moving average. Short term momentum indicators are trending up. Technical score remains at 6.
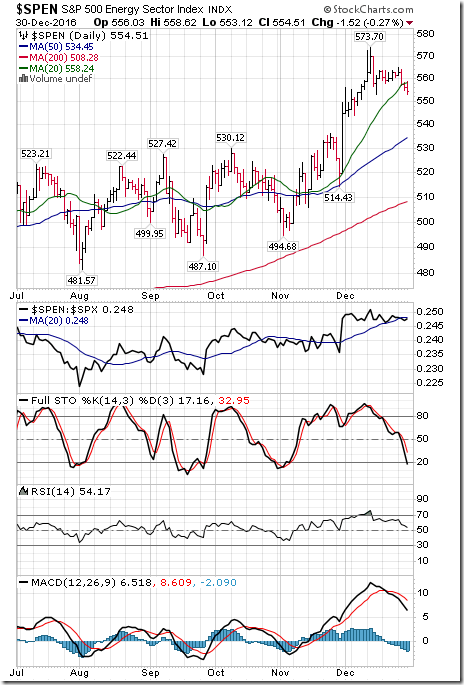
S&P Energy Index dropped 7.05 points (1.26%) last week. Intermediate trend remains up. Strength relative to the S&P 500 Index remains neutral. The Index dropped below its 20 day moving average. Short term momentum indicators are trending down. Technical score slipped to 0 from 2.
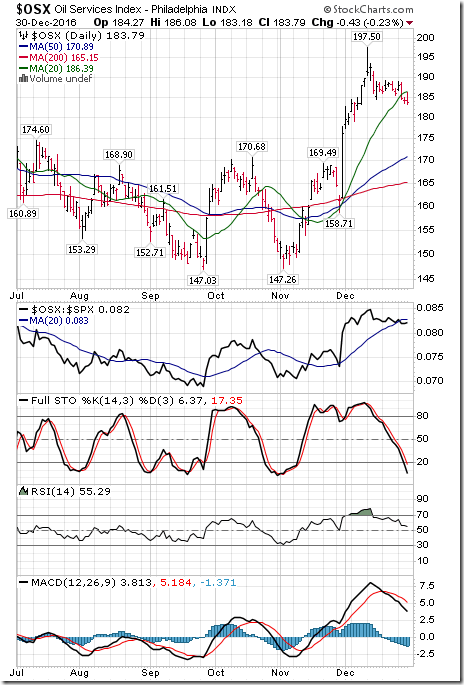
The Philadelphia Oil Services Index dropped 2.10 points (1.13%) last week. Intermediate trend remains up. Strength relative to the S&P 500 Index changed to Neutral from Positive. The Index dropped below its 20 day moving average. Short term momentum indicators are trending down. Technical score dropped to 0 from 4.
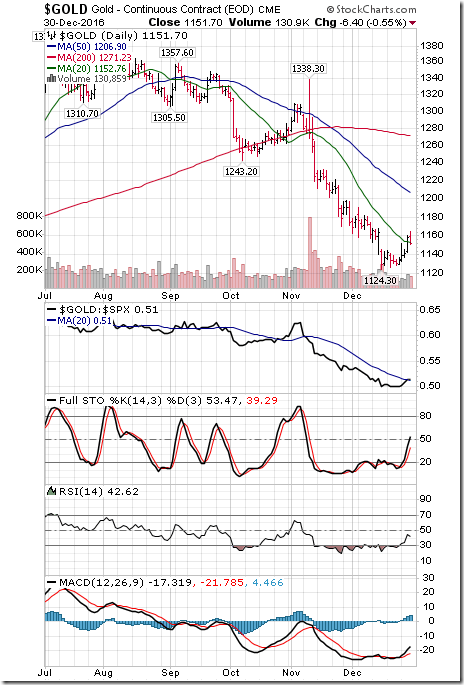
Gold gained $18.10 per ounce (1.60%) last week. Intermediate trend remains down. Strength relative to the S&P 500 Index changed to Neutral from Negative. Gold remained below its 20 day moving average. Short term momentum indicators are trending up. Technical score improved last week to -2 from -6.
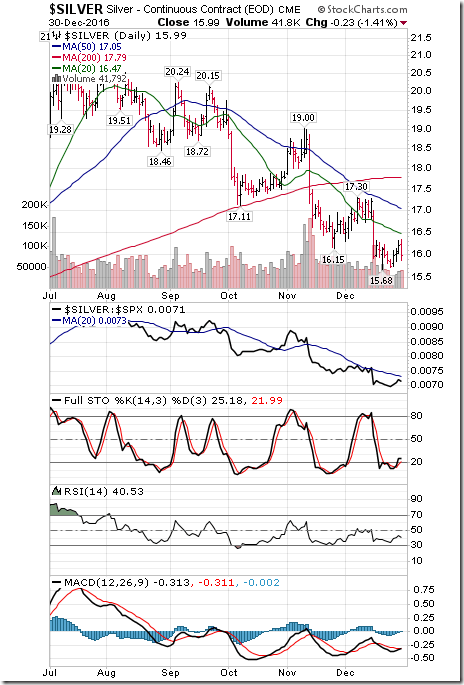
Silver gained $0.23 per ounce (1.46%) last week. Intermediate trend remains down. Strength relative to the S&P 500 Index remains Negative. Silver remained below its 20 day moving average. Short term momentum indicators are trending up. Technical score improved last week to -4 from -6.
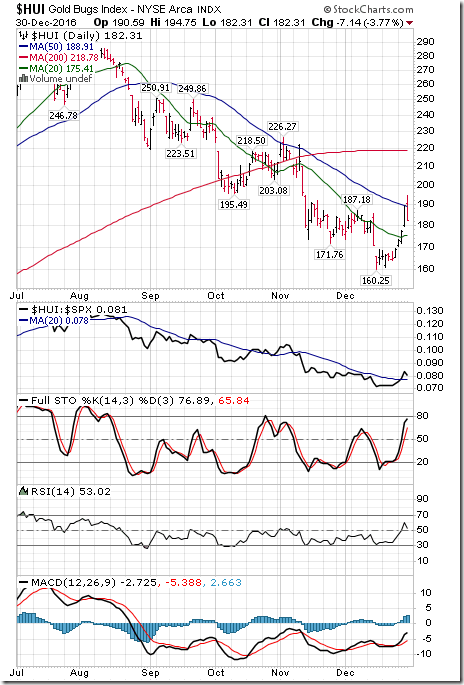
The AMEX Gold Bug Index jumped 13.35 points (7.90%) last week. Intermediate trend changed to Neutral from Down on a move above 187.18. Strength relative to the S&P 500 Index turned Positive from Negative. The Index moved above its 20 day moving average. Short term momentum indicators are trending up. Technical score increased last week to 4 from -4.
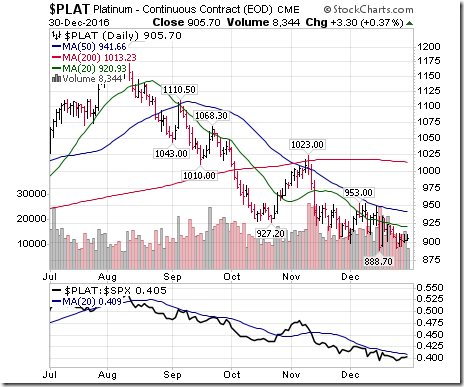
Platinum gained $12.50 per ounce (1.40%) last week. Trend remains down. Relative strength remains Negative. PLAT remains below its 20 day MA. Momentum has just turned up.
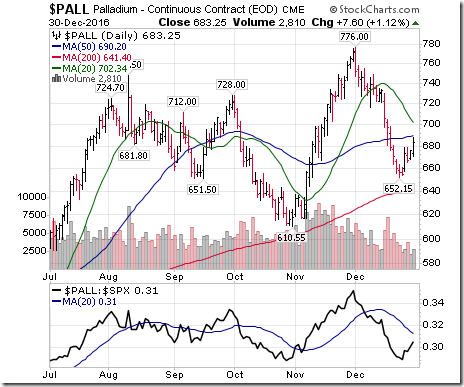
Palladium gained $28.40 per ounce (4.34%) last week. Trend remains up. Strength relative to the S&P 500 Index remains Negative. PALL remains below its 20 day moving average. Short term momentum indicators are trending up. Technical score improved to 0 from -2.
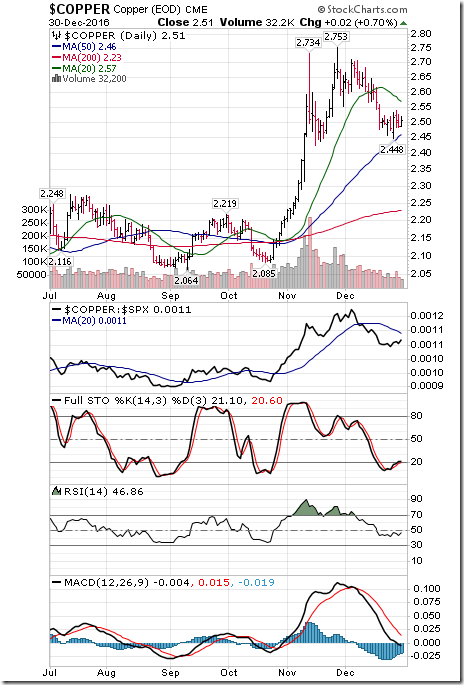
Copper added 3 cents per lb (1.21%) last week. Intermediate trend remains up. Strength relative to the S&P 500 Index remained Negative. Copper remained below its 20 day moving average. Short term momentum indicators are trending down. Technical score remained at -2.
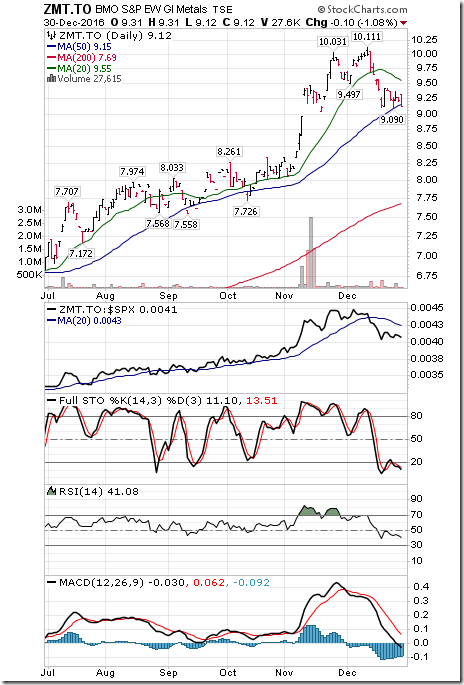
Base Metal ETF dropped another $0.11 (1.20%) last week. Intermediate trend remains Neutral. Strength relative to the S&P 500 Index remains Negative. Units remain below their 20 day moving average. Short term momentum indicators are trending down. Technical score remained last week at -4.
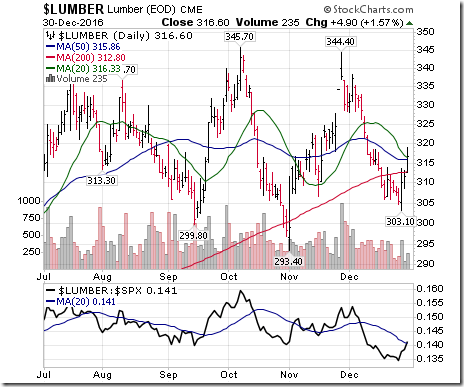
Lumber gained 8.90 (2.89%) last week. Intermediate trend remains Neutral. Relative strength improved to Neutral. Moved above its 20 day MA. Momentum turned positive.
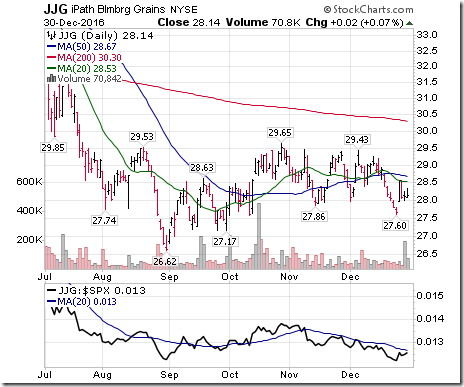
The Grain ETN gained $0.47 (1.70%) last week. Trend remains down. Strength relative to the S&P 500 Index remains Negative. Units remain below their 20 day moving average. Short term momentum indicators are trending down. Technical score increased to -4 from -6.
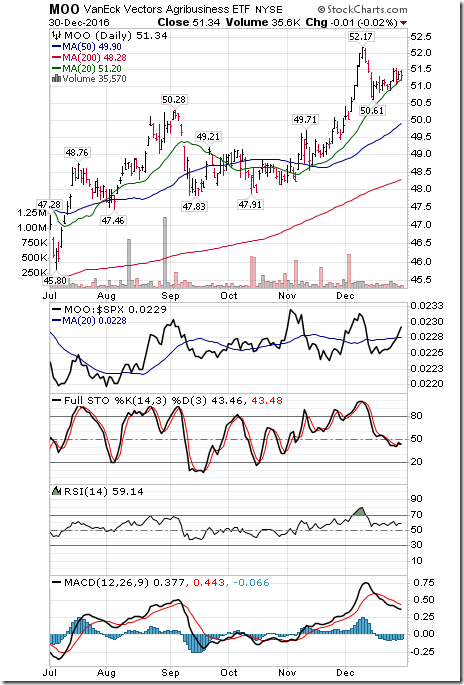
The Agriculture ETF added $0.18 (0.35%) last week. Intermediate trend remains up. Strength relative to the S&P 500 Index remains Neutral. Units remain above their 20 day moving average. Short term momentum indicators are trending down. Technical score remained last week at 2.
Interest Rates
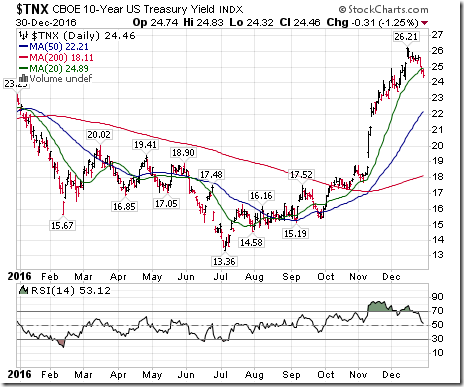
Yield on 10 year Treasuries dropped 9.7 basis points (3.81%) last week. Intermediate trend remains up. Yield dropped below its 20 day moving average. Short term momentum indicators are trending down.
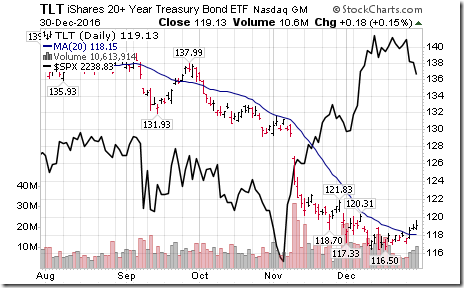
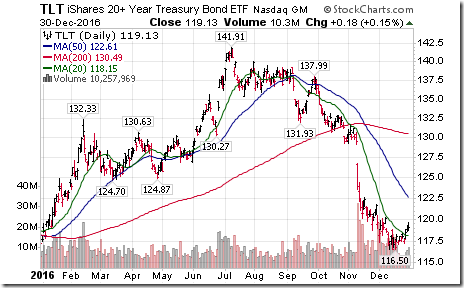
Conversely, price of the long term Treasury ETF gained $1.08 (0.91%) last week. Intermediate trend remains down. Units moved above their 20 day moving average. Short term momentum indicators are trending up.
Volatility
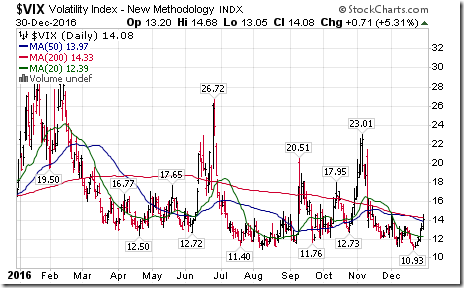
The VIX Index jumped 2.67 (23.40%) last week. The Index moved above its 20 day moving average. Short term momentum indicators are trending up.
Sectors
Daily Seasonal/Technical Sector Trends for December 30th 2016
Green: Increase from previous day
Red: Decrease from previous day
StockTwits Released on Friday
Utilties cementing its position as the top performing sector in December.
Technical action by S&P 500 stocks to 10:00: Quiet. No breakouts. One breakdown: $PNR.
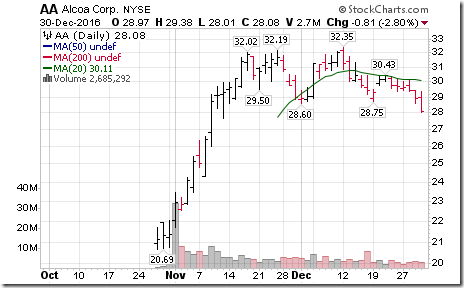
Editor’s Note: After 10:00 AM EST, one stock broke resistance: EXR and six stocks broke support: AVP, TROW, AA, PCLN, GRMN and X.
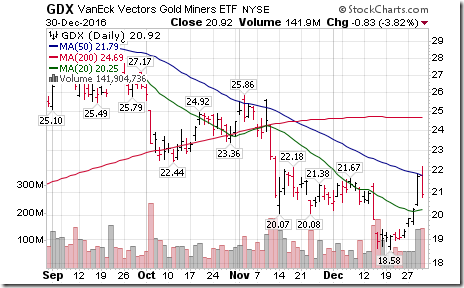
Gold Miner ETF $GDX moved above intermediate resistance at $22.18
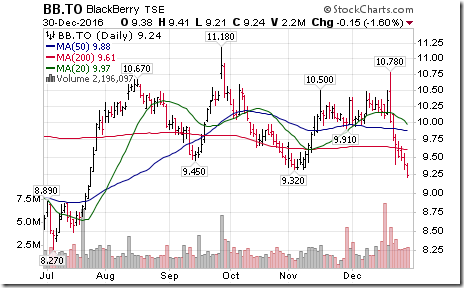
BlackBerry $BB.CA moved below $9.32 completing a Head & Shoulders pattern.
Alcoa $AA completed a short term Head & Shoulders pattern on a move below $28.60
WALL STREET RAW RADIO WITH MARK LEIBOVIT FOR
SATURDAY, DECEMBER 31, 2016
WITH GUESTS HENRY WEINGARTEN, HARRY BOXER AND SINCLAIR NOE:
Accountability Update
Two previously favoured Dow Jones Industrial Average stocks reach a peak of their seasonal strength early this week, Boeing (BA $155.68) and Home Depot (HD $134.08). Favourable seasonal and technical comments were offered on Boeing on October 10th at 136.62 and Home Depot on November 22nd at $131.24. They no longer are favoured as seasonal trades.
Disclaimer: Seasonality and technical ratings offered in this report by www.timingthemarket.ca and www.equityclock.com are for information only. They should not be considered as advice to purchase or to sell mentioned securities. Data offered in this report is believed to be accurate, but is not guarantee
Copyright © DV Tech Talk, Timingthemarket.ca

![clip_image002[5] clip_image002[5]](http://advisoranalyst.com/glablog/wp-content/uploads/HLIC/6b517fd39853beca4246e90d94d989bf.png)
![clip_image002[7] clip_image002[7]](http://advisoranalyst.com/glablog/wp-content/uploads/HLIC/a9d67c662bc54e2b471076571bdb9188.png)
