by Don Vialoux, Timingthemarket.ca
The Bottom Line
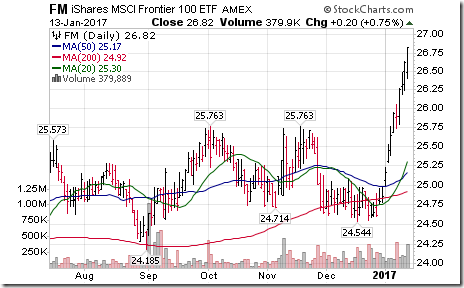
Momentum by U.S. equity markets has deflated significantly during the past three week. The S&P 500 Index, Dow Jones Industrial Average and Russell 2000 Index closed slightly below closing levels on December 21st. In contrast, equity markets outside of the U.S. continue to post significant gains (including the TSX). Classic example is Frontier iShares, up 9.0% since December 22nd.
Uncertainties related to a new Trump Presidency likely will continue into April, implying that better opportunities exist in equity markets outside of the U.S. (including the TSX). Commodity sensitive equity markets and sectors continue to show positive momentum. Stick with them for now.
Economic News This Week
January Empire Manufacturing Index to be released at 8:30 AM EST on Tuesday is expected to slip to 8.3 from 9.0 in December.
December Consumer Price Index to be released at 8:30 AM EST on Wednesday is expected to increase 0.3% versus a gain of 0.2% in November. Excluding food and energy, December Consumer Price Index is expected to increase 0.2% versus a gain of 0.2% in November.
Federal Reserve Chairperson, Janet Yellen is scheduled to speak to Congress as part of her Humphrey Hawkins testimony.
December Industrial Production to be released at 9:15 AM EST on Wednesday is expected to increase 0.6% versus a decline of 0.4%. December Capacity Utilization is expected to increase to 75.4 from 75.0 in November.
Bank of Canada Policy Announcement to be released at 10:00 AM EST on Wednesday is expected to maintain the overnight lending rate at 0.50%.
Fed Beige Book is expected to be released at 2:00 PM EST on Wednesday
Initial Weekly Jobless Claims to be released at 8:30 AM EST on Thursday are expected to increase to 252,000 from 247,000 last week.
December Housing Starts to be released at 8:30 AM EST on Thursday are expected to increase to 1,193,000 units from 1,090,000 units in November
January Philly Fed Index to be released at 8:30 AM EST on Thursday is expected to slip to 15.3 from 21.5 in December
Canada’s December Consumer Price Index to be released at 8:30 AM EST on Friday is expected to be unchanged versus a 0.4% decline in November (1.7% year-over-year).
Canada’s November Retail Sales to be released at 8:30 AM EST on Friday are expected to increase 1.2% versus a gain of 1.1% in November. Excluding auto sales, November Retail Sales are expected to increase 0.4% versus a gain of 1.4% in October.
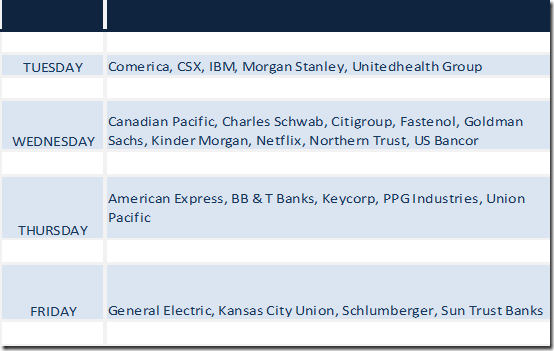
Earnings News This Week
Observations
Technical action by individual S&P 500 stocks was mixed last week. 37 stocks broke intermediate resistance and 23 stocks broke intermediate support. Number of stocks in an intermediate uptrend increased to 336 from 334, number of stocks in a neutral trend increased to 67 from 65 and number of stocks in a downtrend dropped last week to 97 from 101.
Short term momentum indicators (short term momentum indicators, trades above 20 day moving average) for U.S. and Canadian equity markets and economic sensitive sectors are overbought and showing increasing signs of rolling over.
Intermediate technical indicators (Bullish Percent Index, Percent of stocks trading above their 50 day moving average) also are intermediate overbought and showing increasing signs of rolling over.
Fourth quarter reports by S&P 500 companies released to date are off to a good start: Six percent have reported to date. 70% reported higher than consensus earnings (mainly financial service companies), but only 33% reported higher than consensus revenues. Thirty three companies are scheduled to release results this week (including 5 Dow Jones Industrial Average companies: IBM, UnitedHealth Group, Goldman Sachs, American Express and General Electric). 78 companies have issued negative fourth quarter guidance and 34 companies have issued positive guidance. According to FactSet, consensus calls for a 3.2% increase in earnings on a year-over-year basis and a 4.6% increase in revenues.
Prospects beyond the fourth quarter remain favourable. According to FactSet, consensus calls for first quarter 2017 earnings on a year-over-year basis to increase 11.0% and first quarter revenues to increase 7.7%. Consensus calls for second quarter 2017 earnings to increase 10.6% and second quarter revenues to increase 5.8%. Consensus calls for 2017 earnings to increase 11.4% and 2017 revenues to increase 6.0%.
Fourth quarter earnings prospects for TSX 60 companies are much more positive. Consensus calls for an average year-over-year gain of 8.3%. Gains are expected to be most notable by commodity sensitive stocks that have benefitted from higher commodity prices (Crude oil, natural gas, base metals, precious metals).
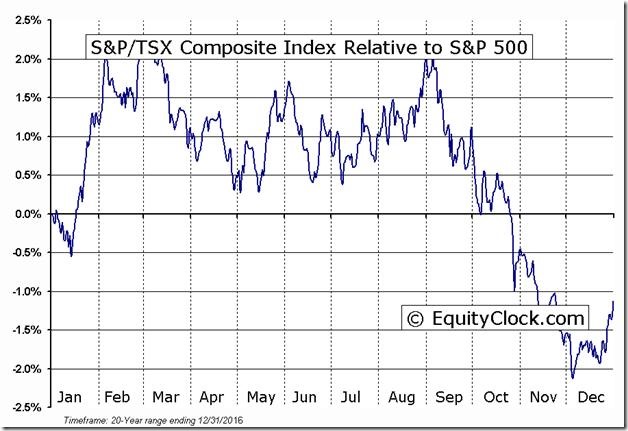
History shows that the TSX Composite Index normally outperforms the S&P 500 Index between now and the end of February. Indices are tracking closely their historic trend.
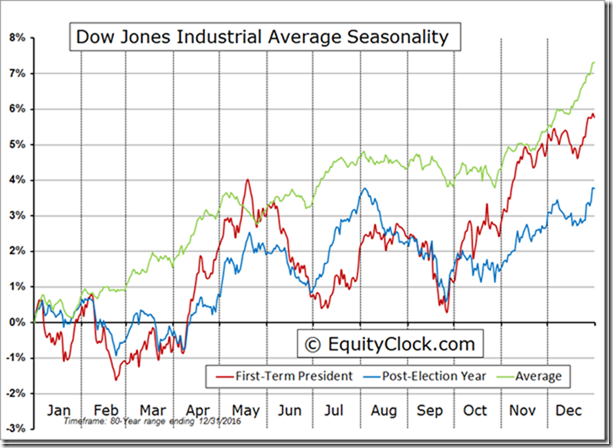
History shows that U.S. equity markets struggle in Post-Election years between Inauguration Day and early April when a new President is elected.
Economic news this week focuses on comments by central bank authorities in the U.S. and Canada (Yellen in the U.S. and Poloz in Canada). Economic data is expected to be mixed
Political focus is on Trump’s Inauguration on Friday and the Congressional vetting of cabinet members. Media reports over the weekend were extremely divisive along party lines.
Note later in this report the significant change in seasonality for a wide variety of equity indices, commodities and sectors that are triggered at the beginning in the third week in January.
Weather in North American can have a short term impact on equity markets. Winter in the first quarter of 2016 was warmer than average (El Nino effect), prompting stronger than average economic growth during the period. This year, weather in the first quarter is influenced by a “La Nina” event, the opposite to an El Nino effect. Weather in the first quarter is forecast by NOAA to be colder than average and wetter than average in Northern U. S. states and southern Canada, implying lower economic activity than the same period last year.
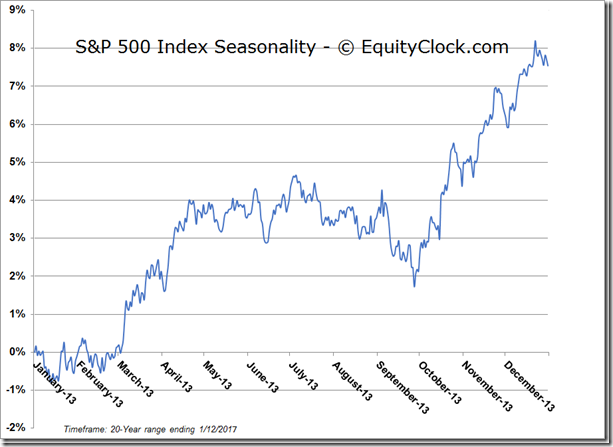
On average during the past 20 years, the S&P 500 Index has tended to move slightly lower to late February.
Equity Indices and Related ETFs
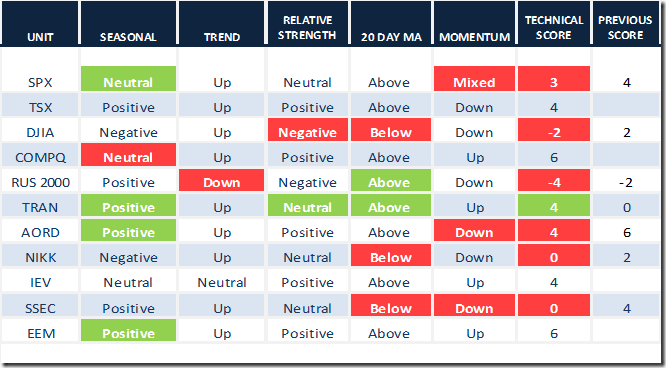
Daily Seasonal/Technical Equity Trends for January 13th 2017
Green: Increase from previous day
Red: Decrease from previous day
Calculating Technical Scores
Technical scores are calculated as follows:
Intermediate Uptrend based on at least 20 trading days: Score 2
Higher highs and higher lows
Intermediate Neutral trend: Score 0
Not up or down
Intermediate Downtrend: Score -2
Lower highs and lower lows
Outperformance relative to the S&P 500 Index: Score: 2
Neutral Performance relative to the S&P 500 Index: 0
Underperformance relative to the S&P 500 Index: Score –2
Above 20 day moving average: Score 1
At 20 day moving average: Score: 0
Below 20 day moving average: –1
Up trending momentum indicators (Daily Stochastics, RSI and MACD): 1
Mixed momentum indicators: 0
Down trending momentum indicators: –1
Technical scores range from -6 to +6. Technical buy signals based on the above guidelines start when a security advances to at least 0.0, but preferably 2.0 or higher. Technical sell/short signals start when a security descends to 0, but preferably -2.0 or lower.
Long positions require maintaining a technical score of -2.0 or higher. Conversely, a short position requires maintaining a technical score of +2.0 or lower.
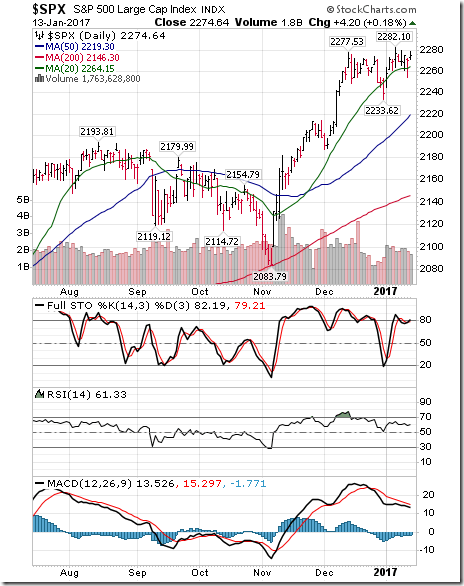
The S&P 500 Index slipped 2.34 points (0.13%) last week. Intermediate trend remains up. The Index remained above its 20 day moving average. Short term momentum indicators have turned mixed.
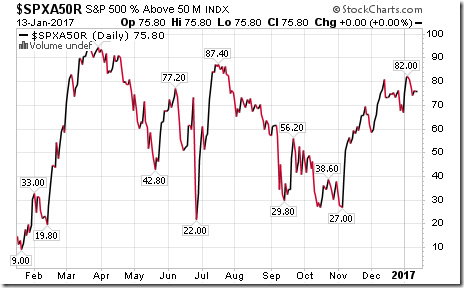
Percent of S&P 500 stocks trading above their 50 day moving average (Also known as the S&P 500 Momentum Barometer) dropped last week to 75.80 from 81.00. Percent remains intermediate overbought and continues to show signs of rolling over.
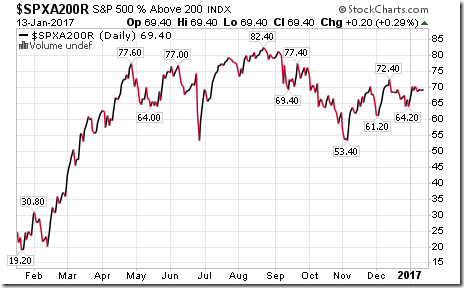
Percent of S&P 500 stocks trading above their 200 day moving average slipped last week to 69.40 from 70.40. Percent remains intermediate overbought and continues to show signs of rolling over.
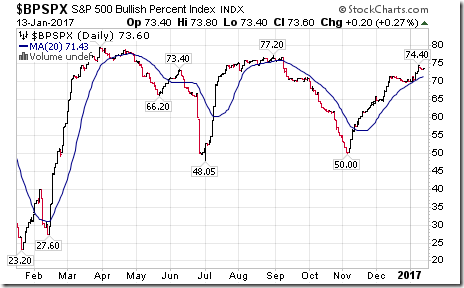
Bullish Percent Index for S&P 500 stocks increased last week to 73.60 from 72.20 and remained above its 20 day moving average. The Index remains intermediate overbought.
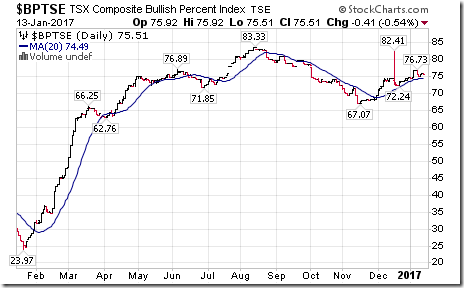
Bullish Percent Index for TSX stocks slipped last week to 75.51 from 76.73, but remained above its 20 day moving average. The Index remains intermediate overbought.
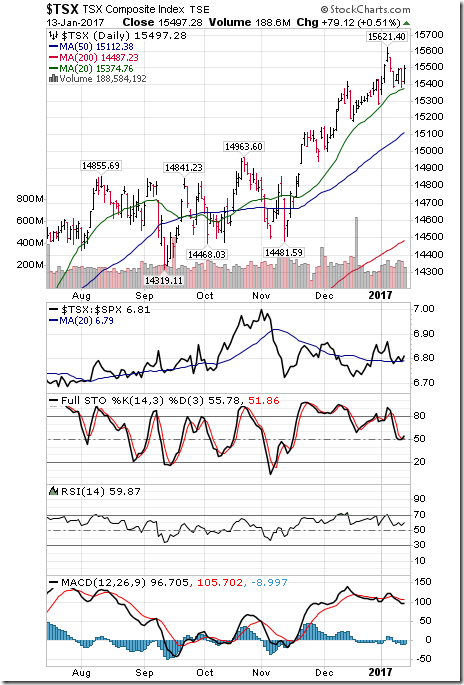
The TSX Composite Index added 1.23 points (0.00%) last week. Intermediate trend remains up (Score: 2). Strength relative to the S&P 500 Index remains positive (Score: 2). The Index remains above its 20 day moving average (Score: 1). Short term momentum indicators turned down (Score: -1). Technical score slipped last week at 4 from 6.
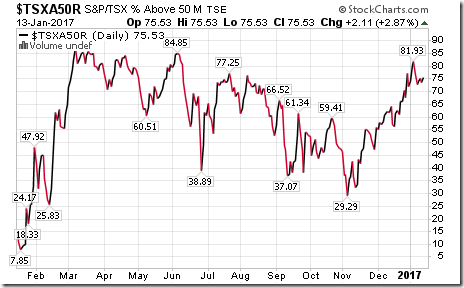
Percent of TSX stocks trading above their 50 day moving average (also known as the TSX Momentum Barometer) slipped last week to 75.53 from 76.79. Percent remains intermediate overbought and continues to show early signs of rolling over.
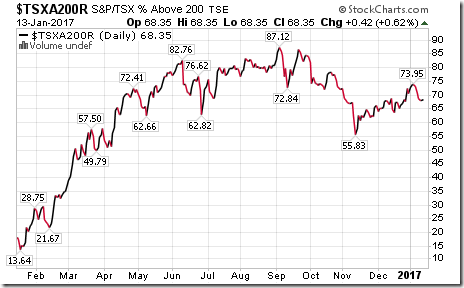
Percent of TSX stocks trading above their 200 day moving average dropped last week to 68.35 from 73.00. Percent remains intermediate overbought and shows early signs of rolling over.
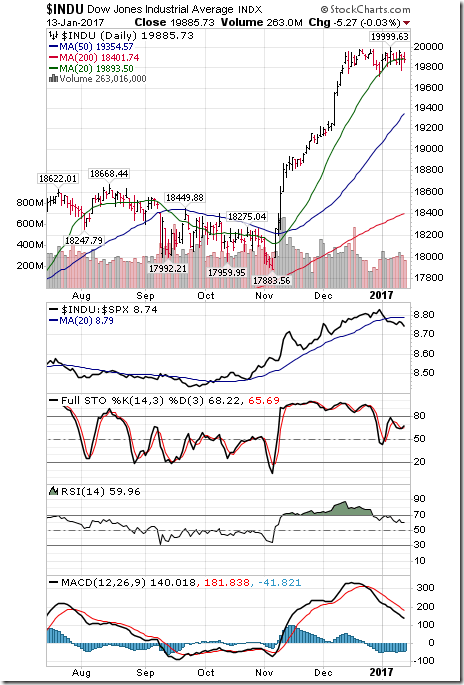
The Dow Jones Industrial Average slipped 78.07 points (0.39%) last week. Intermediate trend remains up. Strength relative to the S&P 500 Index has turned negative. The Average dropped below its 20 day moving average on Friday. Short term momentum indicators have turned down. Technical score dropped last week to -2 from 4.
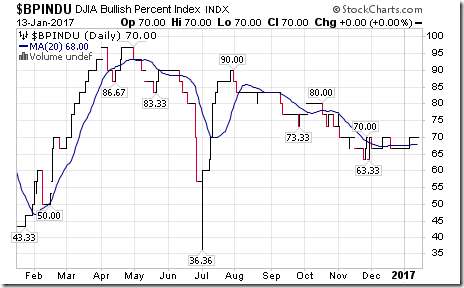
Bullish Percent Index for Dow Jones Industrial Average stocks was unchanged last week at 70.00 and remained above its 20 day moving average. The Index remains intermediate overbought.
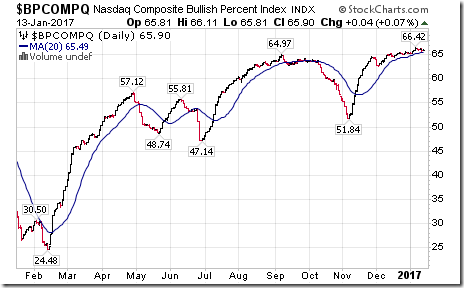
Bullish Percent Index for NASDAQ Composite Index slipped last week to 65.90 from 66.29, but remained above its 20 day moving average. The Index remains intermediate overbought.
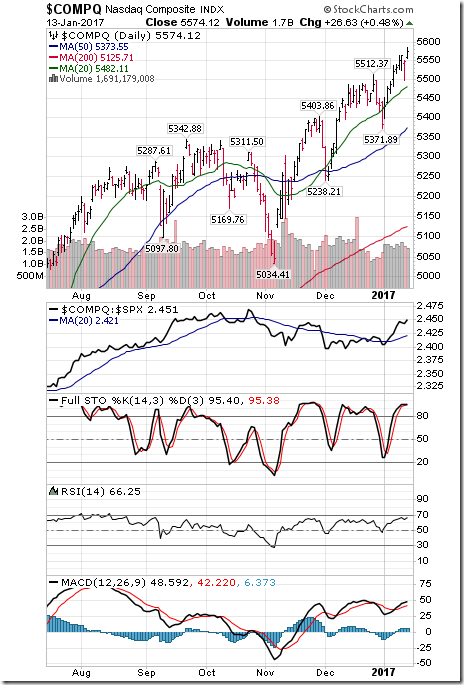
The NASDAQ Composite Index gained 53.06 points (0.96%) last week to an all-time high. Intermediate trend remains up. Strength relative to the S&P 500 Index remains positive. The Index remains above its 20 day moving average. Short term momentum indicators are trending up. Technical score remained last week at 6.
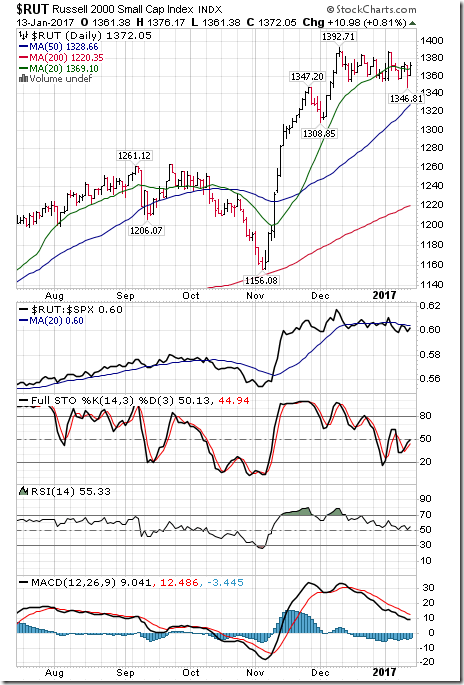
The Russell 2000 Index added 4.77 points (00.35%) last week. Intermediate trend changed to down from up on a move below 1,353.92. Strength relative to the S&P 500 Index remains negative. The Index recovered back above its 20 day moving average on Friday. Short term momentum indicators are trending down. Technical score dropped last week to -4 from 2.
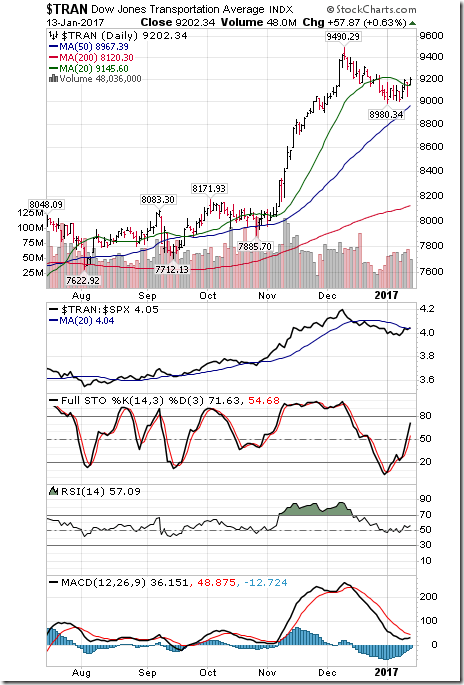
The Dow Jones Transportation Average gained 98.26 points (1.08%) last week. Intermediate trend remains up. Strength relative to the S&P 500 Index changed to Neutral from Negative. The Average moved above its 20 day moving average on Friday. Short term momentum indicators are trending up. Technical score increased last week to 4 from 0.
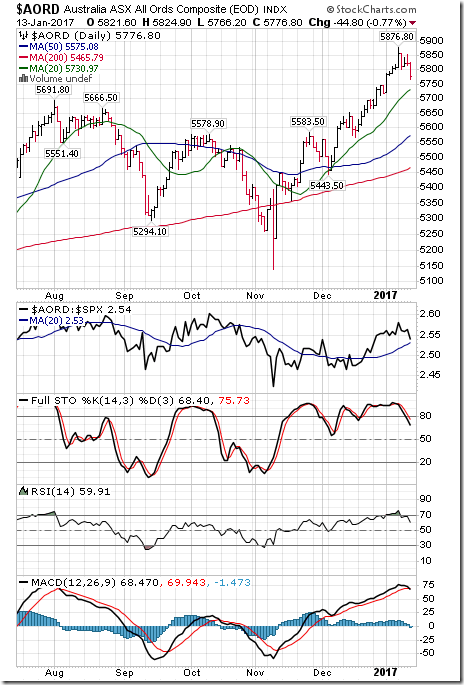
The Australia All Ordinaries Composite Index dropped 32.20 points (0.55%) last week. Intermediate trend remains up. Strength relative to the S&P 500 Index remains positive. The Index remains above its 20 day moving average. Short term momentum indicators have just turned down. Technical score slipped last week to 4 from 6.
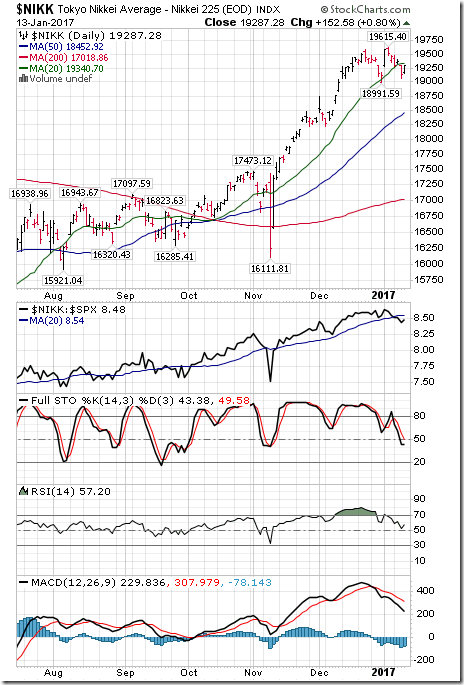
The Nikkei Average dropped 167.05 points (0.86%) last week. Intermediate trend remains up. Strength relative to the S&P 500 Index changed to Neutral from Positive. The Average moved below its 20 day moving average. Short term momentum indicators are trending down. Technical score dropped last week to 0 from 4.
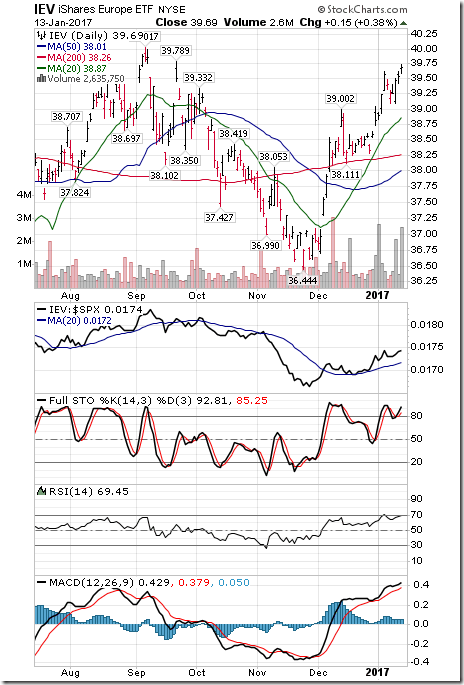
Europe iShares gained $0.28 (0.71%) last week. Intermediate trend remains neutral. Strength relative to the S&P 500 Index remains positive. Units remained above their 20 day moving average. Short term momentum indicators are trending up. Technical score remained last week at 4.
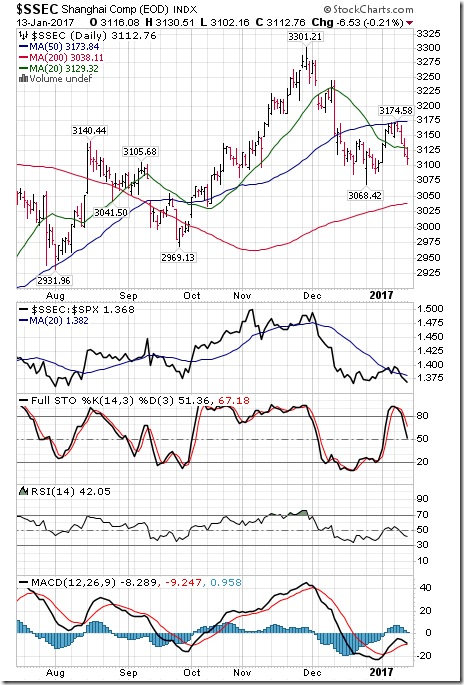
The Shanghai Composite Index dropped 41.56 points (1.32%) last week. Intermediate trend remains up. Strength relative to the S&P 500 Index remained neutral. The Index dropped below its 20 day moving average on Friday. Short term momentum indicators have turned down. Technical score dropped last week to 0 from 4.
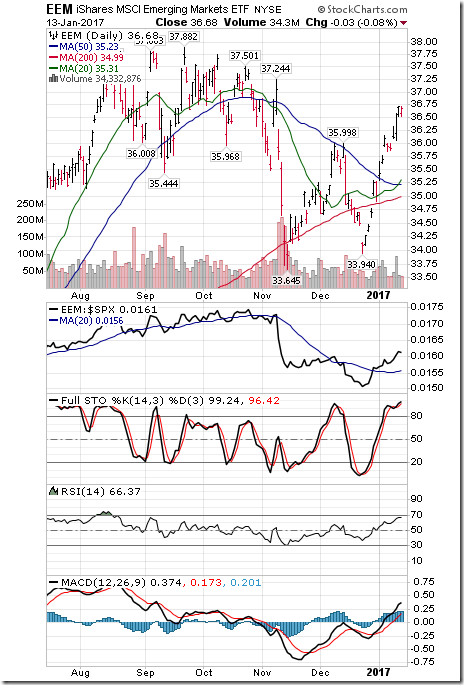
Emerging Markets iShares added another $0.76 (2.12%) last week. Intermediate trend remains up. Strength relative to the S&P 500 Index remains positive. Units remain above their 20 day moving average. Short term momentum indicators are trending up. Technical score remained last week at 6.
Currencies
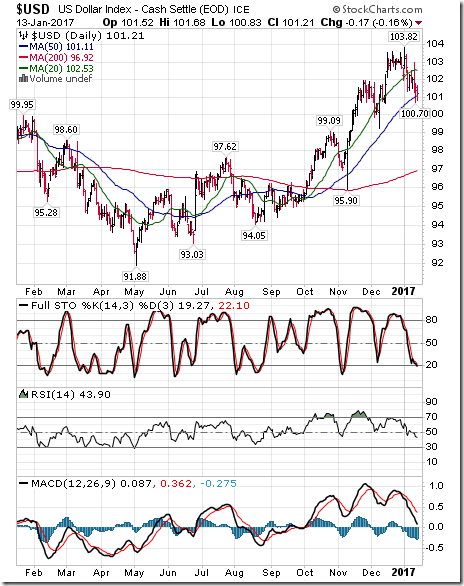
The U.S. Dollar Index dropped 0.96 (0.94%) last week. Intermediate trend remains up. The Index remained below its 20 day moving average. Short term momentum indicators are trending down.
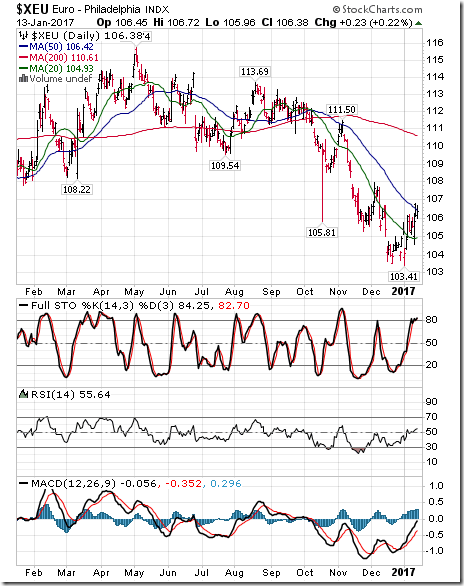
The Euro added 1.15 (1.09%) last week. Intermediate trend remains down. The Euro remained above its 20 day moving average. Short term momentum indicators are trending up.
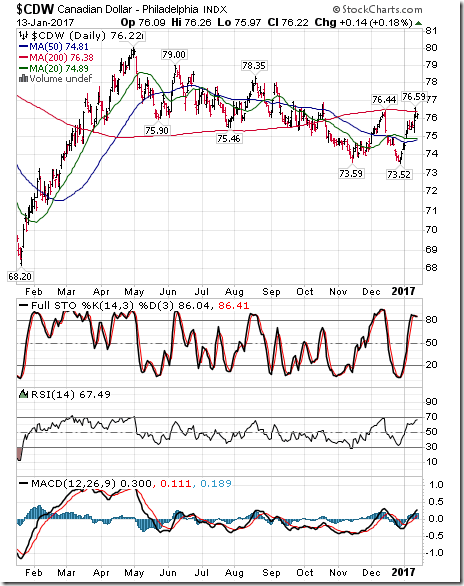
The Canadian Dollar added US 0.62 cents (0.89%) last week. Intermediate trend changed to neutral from down on a move above 76.44. The Canuck Buck remained above its 20 day moving average. Short term momentum indicators are trending up.
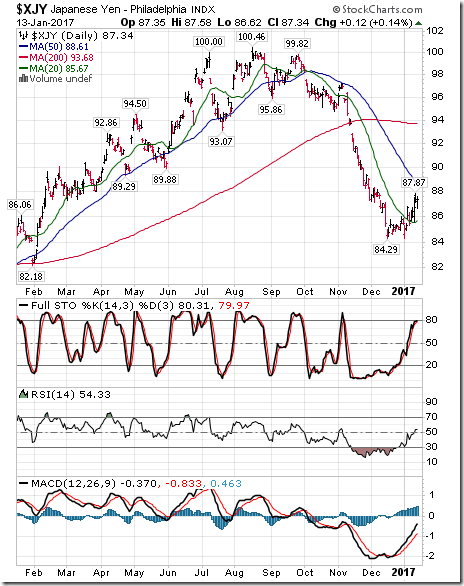
The Japanese Yen gained 0.14 (2.18%) last week. Intermediate trend remains down. The Yen moved back above its 20 day moving average. Short term momentum indicators are trending up.
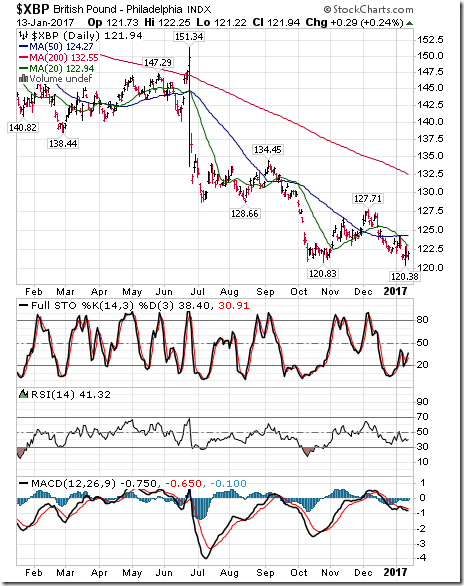
The British Pound dropped 0.90 (0.73%) last week. Intermediate trend changed to down from neutral on a move below 120.83. The Pound remained below its 20 day moving average. Short term momentum indicators are mixed.
Commodities
Daily Seasonal/Technical Commodities Trends for January 13th 2017
Green: Increase from previous day
Red: Decrease from previous day
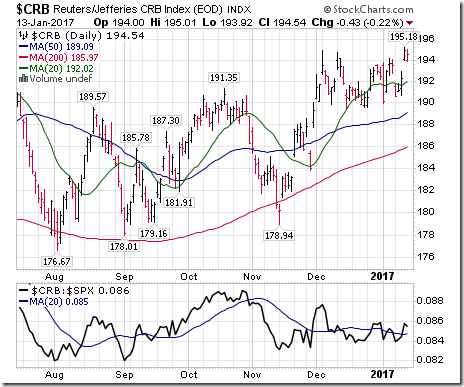
The CRB Index gained 1.00 point (0.52%) last week. Intermediate uptrend was confirmed on a move above 194.91. Strength relative to the S&P 500 Index remains neutral. The Index remains above its 20 day moving average. Short term momentum indicators have just turned back up. Technical score remained last week at 4.
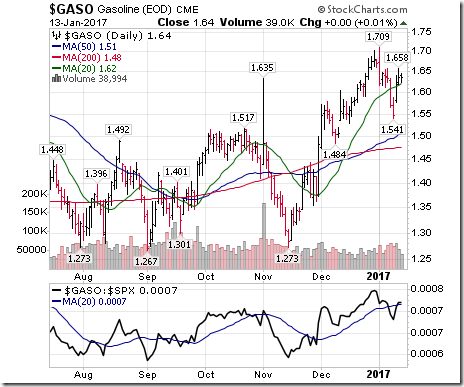
Gasoline gained $0.01 per gallon (0.61%) last week. Intermediate trend remains up. Strength relative to the S&P 500 Index remains neutral. Gas moved back above its 20 day moving average. Short term momentum indicators have turned back up. Technical score remains at 4.
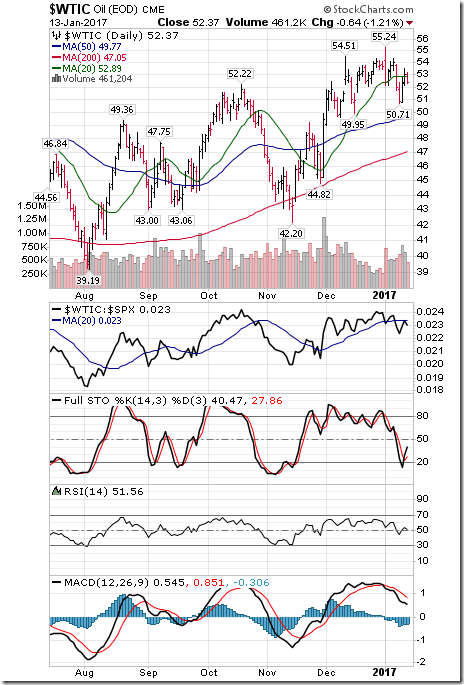
Crude Oil slipped $1.62 per barrel (3.00%) last week. Intermediate trend remains up. Strength relative to the S&P 500 Index turned negative. Crude moved below its 20 day moving average. Short term momentum indicators are trending down. Technical score dropped last week to -2 from 4.
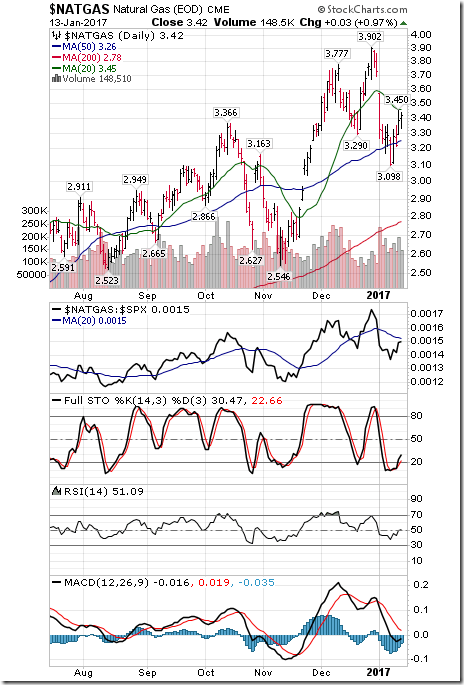
Natural Gas added $0.13 per MBtu (3.95%) last week. Intermediate trend remains neutral. Strength relative to the S&P 500 Index remains negative. “Natty” remains below its 20 day moving average. Short term momentum indicators are trending up. Technical score improved last week to -2 from -4.
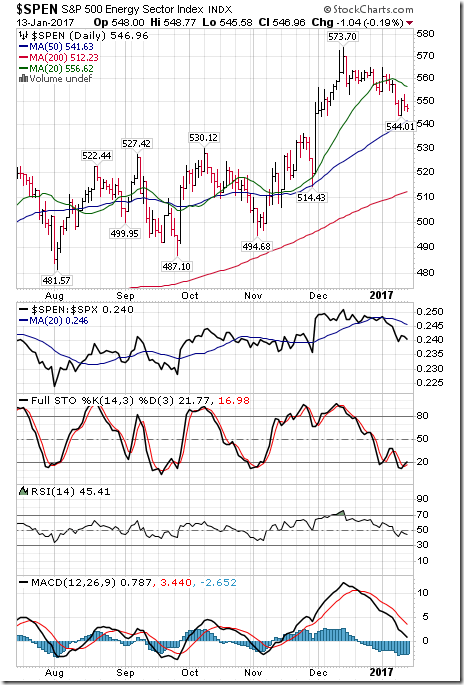
The S&P Energy Index dropped 10.61 points (1.90%) last week. Intermediate trend changed to down from up on a move below 552.85. Strength relative to the S&P 500 Index changed to negative from neutral. The Index remains below its 20 day moving average. Short term momentum indicators are trending down. Technical score dropped last week to -6 from 0.
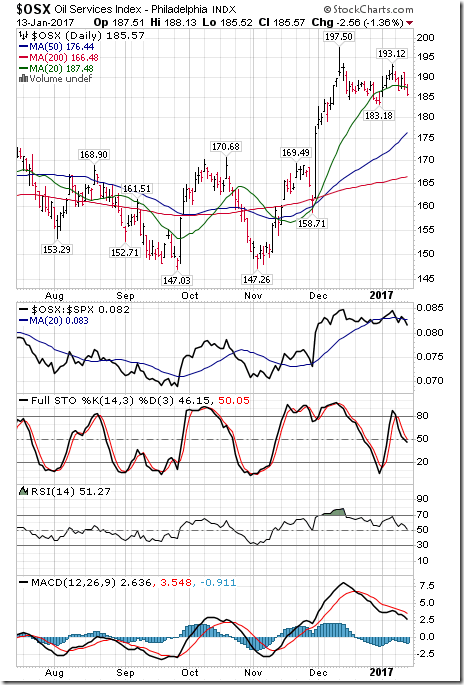
The Philadelphia Oil Services Index dropped 7.09 points (3.68%) last week. Intermediate trend remains up. Strength relative to the S&P 500 Index remains neutral. The Index dropped below its 20 day moving average. Short term momentum indicators are trending down. Technical score dropped last week to 0 from 4.
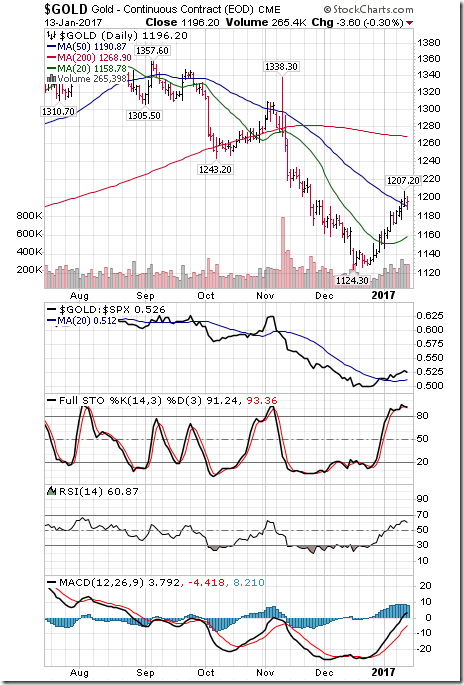
Gold gained $22.80 (1.94%) last week. Intermediate trend remains down. Strength relative to the S&P 500 Index remains positive. Gold remains above its 20 day moving average. Short term momentum indicators are trending up. Technical score remained last week at 2.
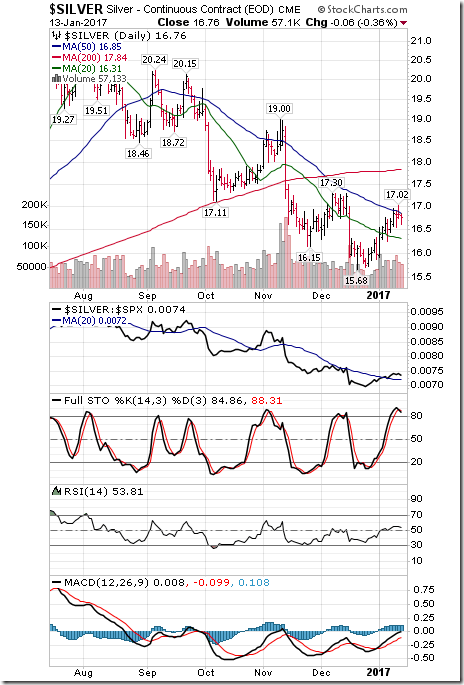
Silver added $0.24 per ounce (1.45%) last week. Intermediate trend remains down. Strength relative to the S&P 500 Index turned positive. Silver remained above its 20 day moving average. Short term momentum indicators are trending up. Technical score improved last week to 2 from 0.
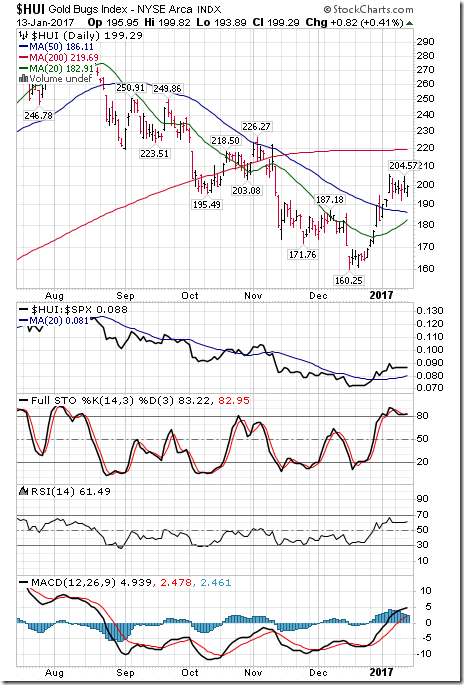
The AMEX Gold Bug Index added 2.73 points (1.39%) last week. Intermediate trend remains neutral. Strength relative to the S&P 500 Index remains positive. The Index remained above its 20 day moving average. Short term momentum indicators are trending up. Technical score remained last week at 4.
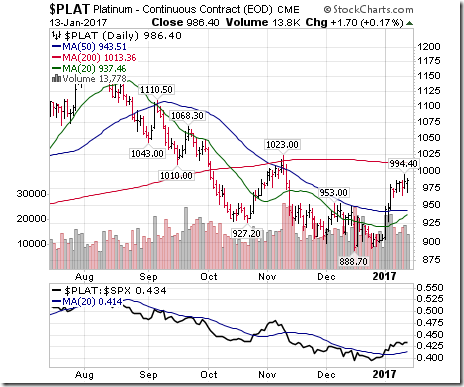
Platinum gained $15.80 per ounce (1.63%) last week. Intermediate trend remains up. Relative strength: positive. Trades above its 20 day MA. Momentum indicators: up. Score: 6
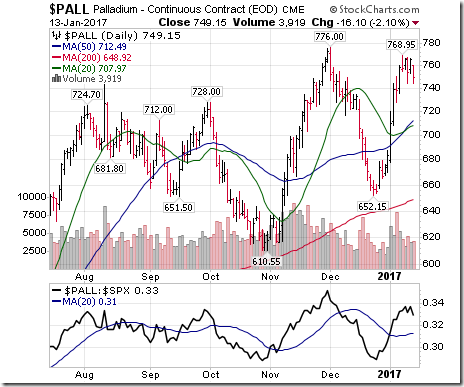
Palladium dropped $9.20 (1.21%) last week. Intermediate trend remains up. Strength relative to the S&P 500 Index remains positive. PALL remains above its 20 day moving average. Short term momentum indicators are trending up. Technical score remains last week at 6.
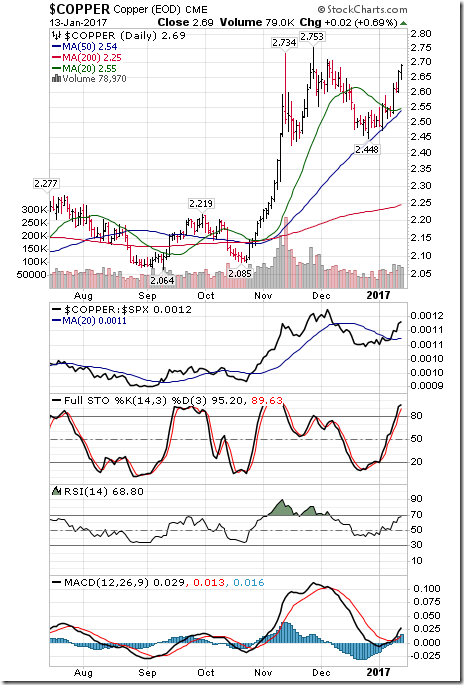
Copper gained $0.14 per lb. (5.49%) last week. Intermediate trend remains up. Strength relative to the S&P 500 Index changed to positive from negative. Copper remained above its 20 day moving average. Short term momentum indicators are trending up. Technical score increased to 6 from 2.
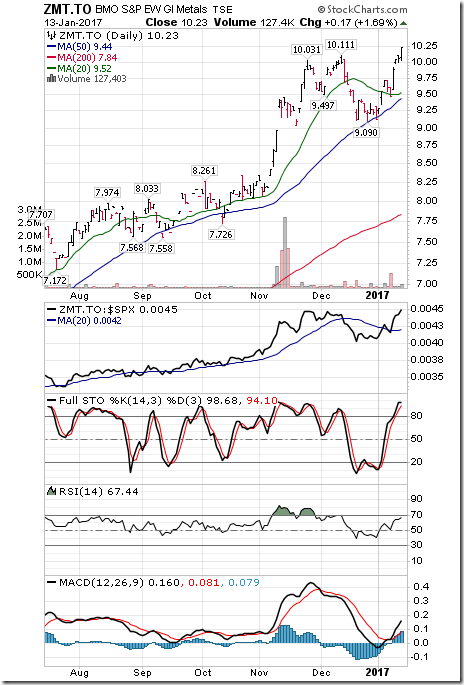
BMO Equal Weight Base Metal ETF jumped $0.63 (6.56%) last week. Intermediate trend changed to up from neutral on a move above $10.11. Strength relative to the S&P 500 Index turned positive. Units remained above their 20 day moving average. Short term momentum indicators are trending up. Technical score increased last week to 6 from 2.
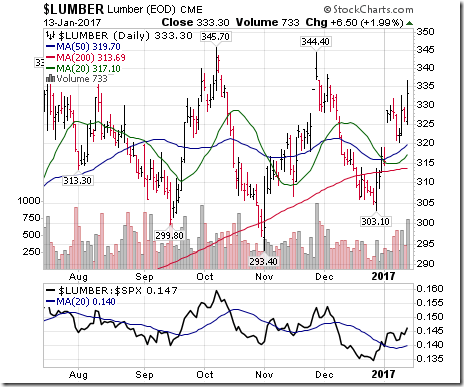
Lumber added 5.10 (1.55%) last week. Trend remains neutral. Relative strength remained positive. Remained above its 20 day MA. Momentum: Positive. Score remains at 4.
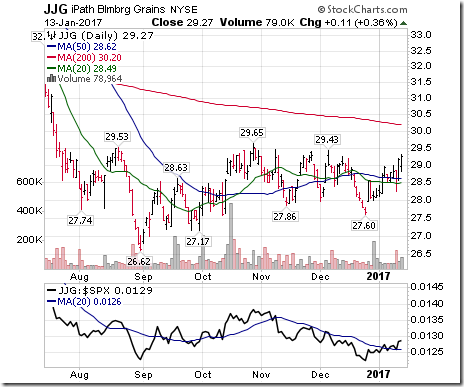
The Grain ETN gained $0.66 (2.31%) last week. Intermediate trend remains down. Strength relative to the S&P 500 Index changed to positive. Units remained above their 20 day moving average. Short term momentum indicators are trending up. Score improved to 2 from 0.
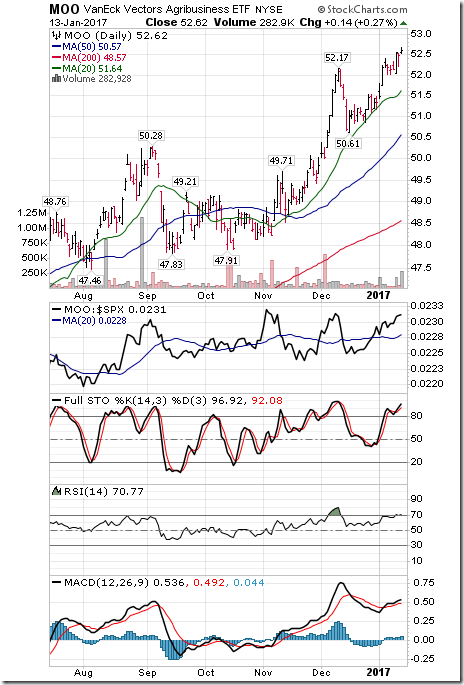
The Agriculture ETF gained another $0.44 (0.84%) last week. Intermediate trend remains up. Strength relative to the S&P 500 Index remains positive. Units remain above their 20 day moving average. Short term momentum indicators are trending up. Technical score remained last week at 6.
Interest Rates
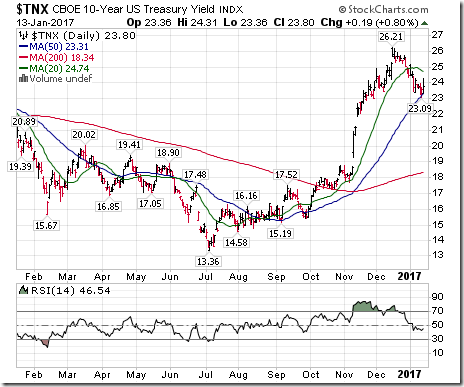
Yield on 10 year Treasuries dropped 3.8 basis points (1.57%) last week. Intermediate trend remains up. Units remained below their 20 day moving average. Short term momentum indicators are trending down.
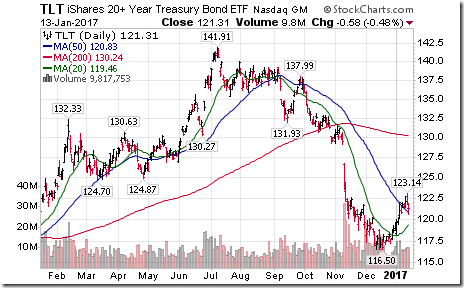
Conversely, price of the long term Treasury ETF gained $1.05 (0.87%) last week. Intermediate trend remains down. Price remains above its 20 day moving average.
Volatility
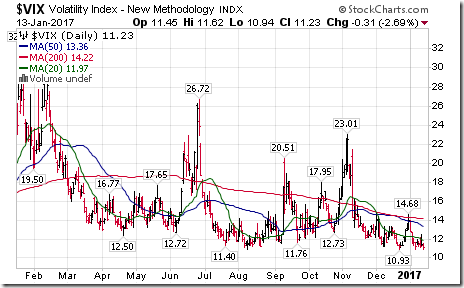
The VIX Index slipped 0.05 (0.44%) last week. Intermediate trend remains down. The Index remains below its 20 day moving average.
Sectors
Daily Seasonal/Technical Sector Trends for January 13th 2017
Green: Increase from previous day
Red: Decrease from previous day
StockTwits Released on Friday
Financials set to report earnings as investors wait for the next market catalyst.
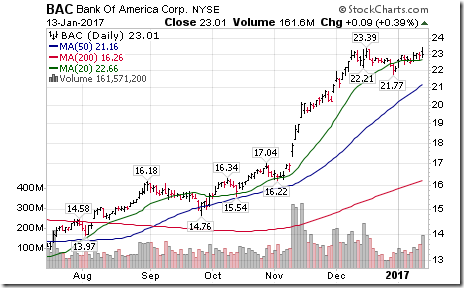
Technical action by S&P 500 stocks to 10:00:Bullish. Breakouts: $BAC $NTRS $PH $SNA $FSLR. No breakdowns
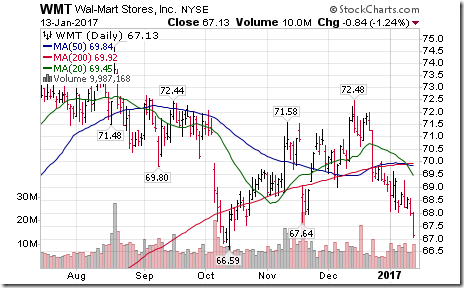
Editor’s Note: After 10:00 AM EST, breakouts included AMAT, TXN and WAT. Breakdown: WMT
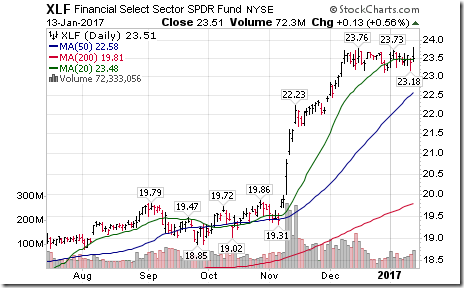
Financial SPDRs $XLF moved above $23.76 to a 9 year extending an intermediate trend.
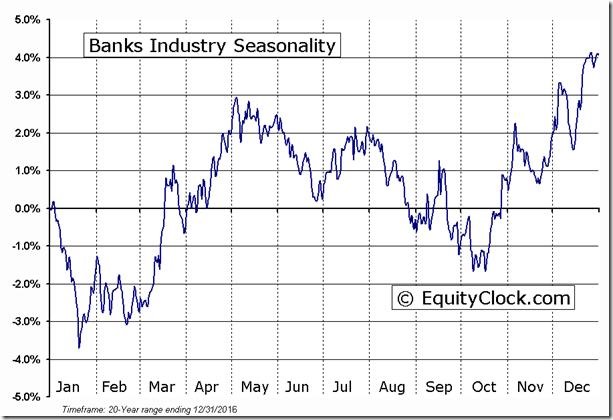
‘Tis the season for U.S. Bank stocks to move higher to the end of April! $XLF $KBE $KRE
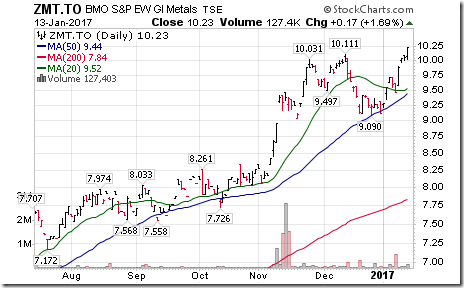
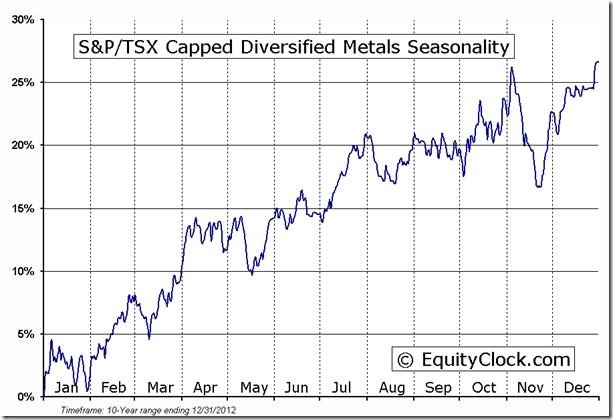
BMO Equal Weight Metals ETF $ZMT.CA moved above $10.11 to 18 month high extending uptrend.
‘Tis the season for TSX base metal equities and related ETFs to move higher to early April $ZMT.CA
Wal-Mart $WMT, a Dow Jones Industrial stock moved below support at $67.64
WALL STREET WEEK RADIO WITH MARK LEIBOVIT – JANUARY 14, 2017 –
WITH GUESTS HARRY BOXER, HENRY WEINGARTEN, BILL MURPHY FROM GATA.ORG AND SINCLAIR NOE http://tinyurl.com/hr3v6r8
Accountability Report
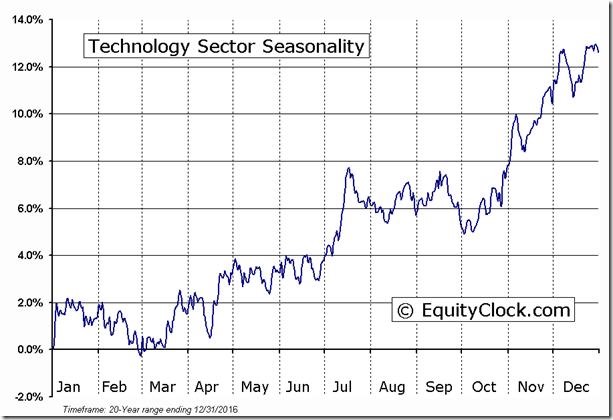
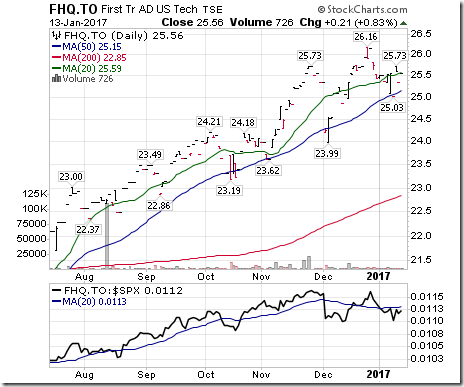
A technology ETF, FHQ.TO $25.56 was one of Tech Talk’s top picks at $23.43 when appearing on BNN on October 14th. Units were favoured for a seasonal trade to mid-January. The period of seasonal strength on a real and relative basis has just ended. In addition, FHQ.TO recently began to underperform the S&P 500 Index and its short term momentum indicators have rolled over from overbought levels. Accordingly, units no longer are favoured.
Technology Sector Seasonal Chart
TECHNOLOGY Relative to the S&P 500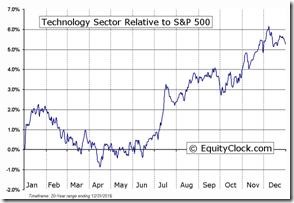 |
Disclaimer: Seasonality and technical ratings offered in this report and www.equityclock.com are for information only. They should not be considered as advice to purchase or to sell mentioned securities. Data offered in this report is believed to be accurate, but is not guaranteed
Copyright © DV Tech Talk, Timingthemarket.ca

![clip_image002[5] clip_image002[5]](http://advisoranalyst.com/glablog/wp-content/uploads/HLIC/3612f5cffdedf93513da0eaa347a6228.png)
![clip_image002[7] clip_image002[7]](http://advisoranalyst.com/glablog/wp-content/uploads/HLIC/37c6ea8c0096117b97f224ad5be64e00.png)
