“Next Year in Jerusalem" is an expression of spiritual hope that Jerusalem be rebuilt spiritually, as the spiritual center of the world, with the Holy Temple and the manifest Presence of God on earth, at its center. But that is tied to geography and the physical presence of Jews in the flourishing modern city of Jerusalem. The latter is essential for the former. We should be truly grateful for the rebuilding of our holy city and understand that the renewal of Jewish life and sovereignty in Israel is part of the process of ultimate redemption.
. . . Anonymous
As most of you know, I was in Europe for 19 days seeing institutional accounts and speaking at conferences. However, the last few days of the trip were spent with our new institutional affiliate Oscar Gruss & Son in Israel, where Avi Avital and Ronen Cohen met me at Ben Gurion Airport along with Bena Mantel (benamantel@gmail.com). Bena is tour guide to the stars, having taken the Rolling Stones, Madonna, etc. on tours of Jerusalem. We began driving toward Jerusalem on Route 443 when all of a sudden there were high fences with ribbon wire on each side of the divided highway with guard towers about every mile. Bena told us this is the most guarded highway in the world (see chart 1 on page 3). As Edmund Sanders of the Los Angeles Times writes:
Reporting from Highway 443, West Bank — Cruising down this disputed four-lane highway, with all its twists and turns, is like taking a road trip through the Israeli-Palestinian conflict. You pass the walls and barriers that keep Palestinians from accessing Highway 443 as it slices through their land. Then there are the hazardous corridors where Israeli drivers have been shot and killed.
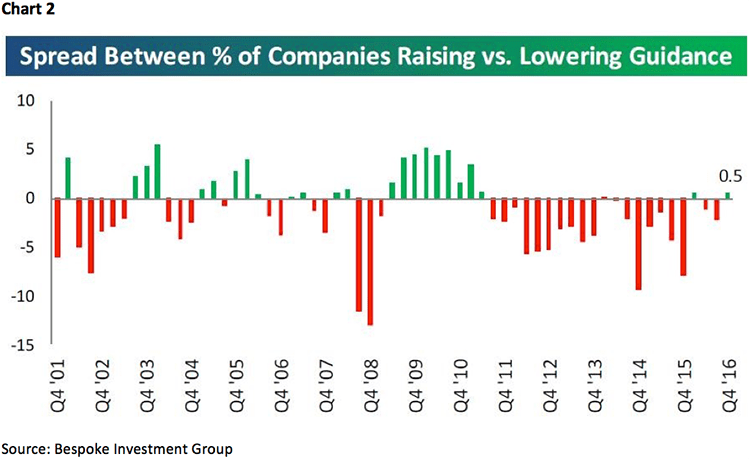
Shortly thereafter we arrived in Jerusalem where we stood in the room of the “last supper,” visited Jesus’ tomb, walked the path Jesus walked on Palm Sunday, well you get the idea. I have been to places all over the world, but Jerusalem was heavenly! I am going back and if you have not been I suggest going. The next day the three of us went to see portfolio managers in Tel Aviv, a city that reminds me very much of Miami. Like in Europe the questions were much the same; what about President Trump, what about a trade war, what’s going on with Mexico, is the U.S. dollar going higher, are valuations too high, etc. Andrew Adams’ and my message has been pretty consistent in that we continue to believe the secular bull market has years left to run and that we are transitioning from an interest-rate-driven bull market to an earnings-driven bull market. To this point of the some 400 companies that have reported 4Q16 earnings, 64% have beaten the consensus estimates, and 56% have bettered revenue estimates. Importantly, more companies are raising forward earnings guidance (chart 2). Sticking with the earnings theme, of the companies that have beaten earnings and revenue estimates, as well as raising forward earnings guidance, screen bullishly on our models, and are positively rated by our fundamental analysts, here are three from our research universe: Alibaba (BABA/$102.07/Strong Buy); Netflix (NFLX/$142.45/Outperform); and ServiceNow (NOW/$90.09/Strong Buy).
Turning to the equity markets, last week the D-J Industrial Average (INDU/20093.78) finally pushed through the 20000 mark. Going back to 1906 when the INDU first traveled above 100, and every 1000 mark since then (1000, 2000, 3000, etc.), the record shows the senior index is higher by almost 9% 12 months later 68% of the time. Also of note, in the Industrials’ assault on 20000 a Dow Theory “buy signal” was registered as both the Industrials and the D-J Transportation Average (TRAN/9444.28) traded out to new all-time highs. The question then becomes, “Is this the beginning of another new leg to the upside, or is this a trading top?” This week should resolve that question. Our message has been pretty clear in that the short and intermediate models have suggested the stock market should grind higher into late-January/early-February where a window of downside vulnerability arrives. That does not mean the models are correct. They are right more than they are wrong, but sometimes they are indeed wrong. If that is the case here we will adapt accordingly. But, until they are proved wrong we are sticking with our models. As a sidebar, the long-term model flipped positive in October 2008 and has not turned negative since.
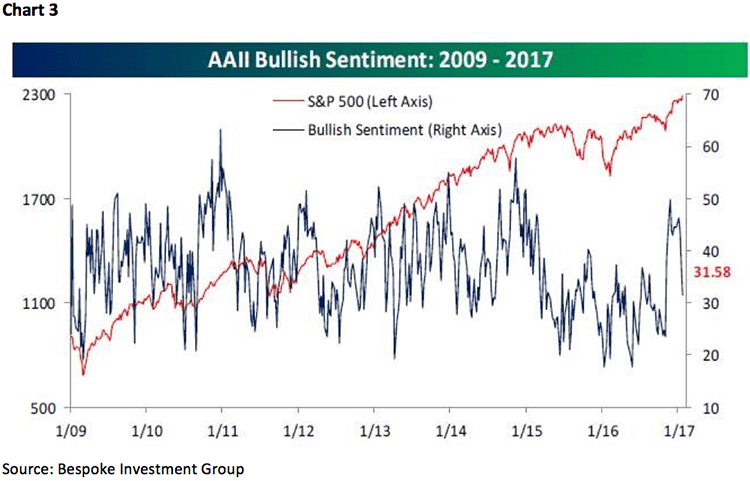
So, we have become more cautious over the past few weeks in accordance with said models. Also a potential “red flag’ comes from last week’s AAII bullish sentiment figures, which showed that bullish sentiment fell by roughly five points (37.01% to 31.58%) for the second five-point decline in the last two weeks (chart 3 on page 4). That has not happened since May 2016 right before the S&P 500 (SPX/2294.69) fell 6.0%. And then there is this from Jeffrey Hirsch at Stock Trader’s Almanac:
“Since 1950, January S&P 500 gains of 2% or more corrected or consolidated in February 62.1% of the time. In the 20 years that the S&P 500 gained 4% or more in January, 65.0% of the time the S&P declined or finished flat (less than 1% gain) in February.”
As for last week’s GDP report, it is backward looking. We think the stock market is forward looking and is anticipating better GDP growth ahead driven by less regulation and a lower corporate tax rate. As our economist Scott Brown, Ph.D. writes:
Market reaction should be limited (as investors remain focused on the economy ahead). About as expected (while the median forecast was 2.1%, but December inventory and foreign trade data, released yesterday, suggested a headline number of about 1.9%). Consumer spending growth remained strong. Business fixed investment picked up (structures down, but equipment advanced for the first time in five quarters, intellectual property products continued to strengthen). Homebuilding bounced back (after falling in two consecutive quarters). Inventories rose more than anticipated, adding a full percentage point to the headline GDP growth figure. Exports fell about as expected, but imports jumped – net exports subtracted 1.7 percentage point from headline GDP growth, but that DOES NOT mean that foreign trade is a drag on growth. Higher imports are a sign of strength in the domestic economy (but imports have a negative sign in the GDP calculation). Private Domestic Final Purchases (GDP less net exports and the change in inventories), the best measure of underlying domestic demand, rose at a 2.8% annual rate (+2.4% y/y). Note that income figures were soft, as some people likely shifted income to 2017 (to take advantage of expected lower tax rates).
The call for this week: The maelstrom our President has unleashed over immigration, and the seven countries under temporary ban, is yet another reason to honor our models’ cautionary stance in the near-term. Our advice to such celebrities as Madonna is to “Take a Breath,” exhale, and see what happens going forward. Our country is amazingly dynamic and the equity markets are only impacted by such events in the short-term. Longer-term we remain convinced the equity markets are in a secular bull market that has years left to run.