With the recent move down in the Commodity asset class in the SIA Asset Class Rankings, this week we will re-examine a key commodity in natural gas using the Natural Gas Continuous Contract (NG.F). In the second chart we will look at a comparison of natural gas, the commodity, to natural gas equities to see how this relationship has played out over the last year and a bit.
Natural Gas Continuous Contract (NG.F)
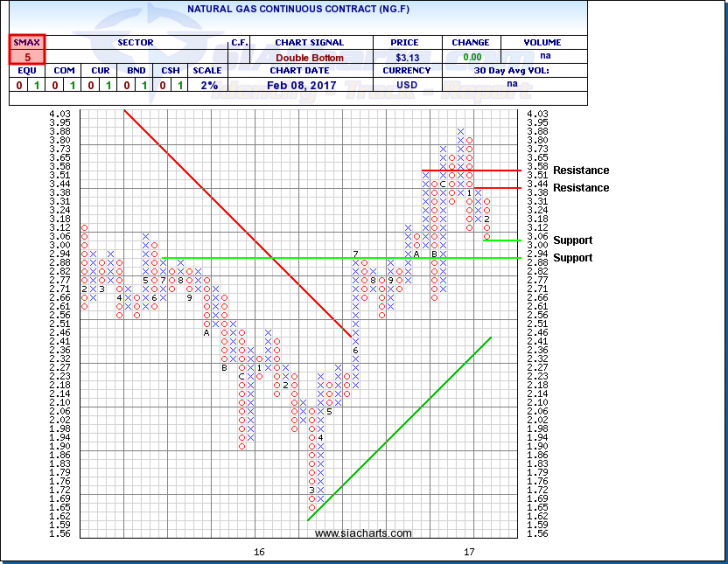
We last looked at Natural Gas Continuous Contract (NG.F) on December 15th, 2016 and since then have seen short-term strength turn into weakness. At that time, NG.F was sitting at $3.54 after just pulling back from it’s intermediate term highs and resistance at $3.80. This pullback continued until finding some support at $3.24, reversing into a column of X’s and pushed two boxes above the $3.80 level of resistance to $3.95. After hitting the $3.95 level, NG.F reversed again and has yet been able to mount another short term rally back to those highs. On Wednesday, NG.F closed at $3.13.
Looking at the chart we can see support for NG.F at $3.00 and below this at $2.88. Intermediate term resistance comes in at $3.44 and above this at $3.58, levels which need to be tackled first before getting another look at it’s 2016 highs. With a current SMAX for the NG.F sitting at a 5 out of 10, it is exhibiting some near-term weakness versus the asset classes.
Click on Image to Enlarge
Natural Gas Continuous Contract (NG.F) vs. First Trust ISE-Revere Natural Gas ETF (FCG)
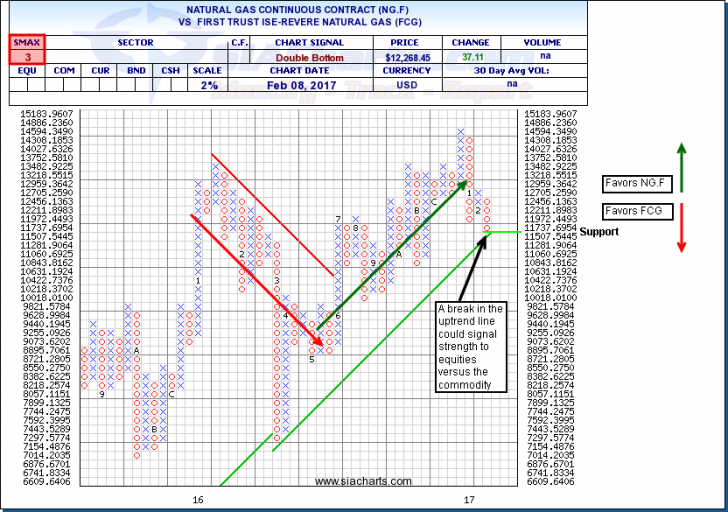
Next we will take a look at a comparison chart of Natural Gas Continuous Contract (NG.F) versus the First Trust ISE-Revere Natural Gas ETF (FCG) to get a view of how the natural gas commodity has done relative to natural gas equities. The First Trust ISE-Revere Natural Gas ETF (FCG) seeks to track the investment results of an equity index called the ISE-Revere Natural Gas™ Index. The ISE-Revere Natural Gas Index is an equal-weighted index comprised of exchange-listed companies that derive a substantial portion of their revenues from the exploration and production of natural gas.
Looking at a 2% comparison chart we can see that through the first half of 2016, the downtrend seen in the chart is in favor of FCG. This means that the natural gas equities were out performing the commodity. This trend reached a bottom in March 2016 and broke through the downtrend line in June, signalling strength to the commodity. This uptrend in the chart is still in tact today, however, we can see the chart sitting on support at the long-term uptrend line. It will be interesting to see if the chart will reverse and continue in favor of NG.F, or if the market begins to price in the outperformance in the commodity relative to natural gas equities and breaks through the uptrend line.
As a reminder, the VS SMAX score is a short term relative strength measure between the two securities that are being compared. A VS SMAX greater than 5 is in favor of the numerator in the chart and a VS SMAX less than 5 is in favor of the denominator. The VS SMAX of 3 out of 10 is signalling short term relative strength to FCG over NG.F.
Click on Image to Enlarge
SIACharts.com specifically represents that it does not give investment advice or advocate the purchase or sale of any security or investment. None of the information contained in this website or document constitutes an offer to sell or the solicitation of an offer to buy any security or other investment or an offer to provide investment services of any kind. Neither SIACharts.com (FundCharts Inc.) nor its third party content providers shall be liable for any errors, inaccuracies or delays in content, or for any actions taken in reliance thereon.
For a more in-depth analysis on the relative strength of the equity markets, bonds, commodities, currencies, etc. or for more information on SIACharts.com, you can contact our sales and customer support at 1-877-668-1332 or at siateam@siacharts.com.
Copyright © SIACharts.com