by Lance Roberts, Clarity Financial
#FakeNews In Investing
I regularly push back on the “buy and hold” investing m
eme because while it works in “theory,” reality has a far different outcome. This is not my opinion, it is the reality of human emotion and psychology as it impacts portfolio management over time. The annual Dalbar Investor survey shows the massive performance lag of individuals not only in the short-term but in the long-term as well. To wit:
- In 2015, the 20-year annualized S&P return was 8.19% while the 20-year annualized return for the average equity mutual fund investor was only 4.67%, a gap of 3.52%.
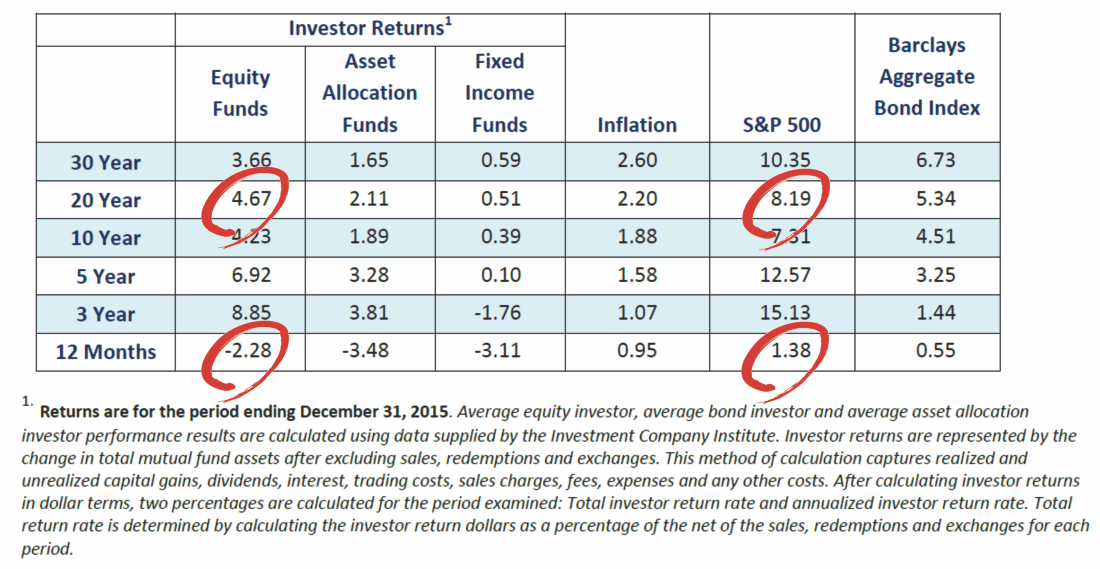
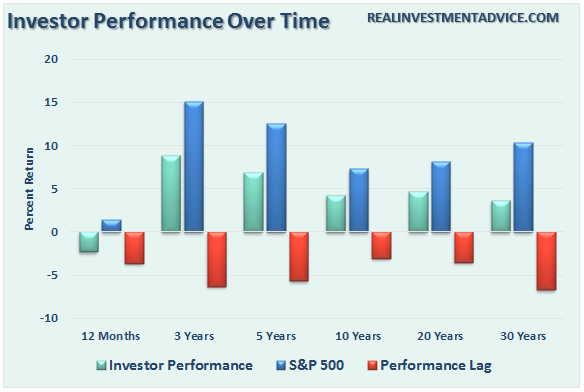
Here is a visual of the lag between expectations and reality.
Importantly, THERE IS NO evidence linking investment recommendations to average investor underperformance. Analysis of the underperformance shows that investor behavior is the number one cause, with fees being the second leading cause.
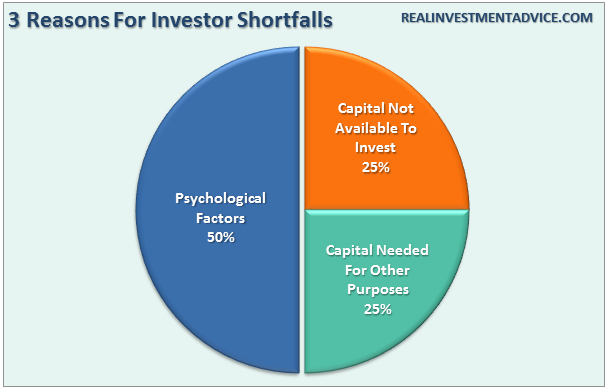
There are THREE reasons why “buy and hold” investment strategies DO NOT WORK according to the Dalbar study:
So, why am I bringing this up?
After recently pinging on the fallacy of “passive investing,” because you are not passive, I invariably receive push back from advisors who cling to the hope that markets will continue to rise indefinitely. Such as this one:
“Just caught up with your latest effort in the fake news category. The thrust of your argument seems to be, wrongly as usual, that active outperforms passive in bear markets.” – Brent
Actually, no, that is not my argument.
My consistent argument is individuals, like Brent, mislead themselves, or their clients, by suggesting they will get average rates of return over time. They won’t and they don’t.
Markets do NOT compound returns, you do not get average returns, and you do not have 100-plus years to reach your goal.
Investing without a discipline or skill set is easy when the “bull market” is running. It is when the next “bear market” growls where individuals will be decimated as the mean reverting event takes its toll. As history proves, everyone has a threshold of pain – and bear markets always exert the pain required to force investors out near the bottom.
This is just reality and why protecting capital during market declines is much more critical that chasing returns during market advances.
Furthermore, there is substantial evidence that a good manager with the right skill set can outperform over time. It took me about 5-minutes with a screener to find mutual funds that have outperformed the Vanguard S&P Index fund over the last 20-years.

Take the best performing fund over the last 20-years out of our group above. Sequoia has had a rough couple of years and is severely underperforming the market in the short-term. According to the current mentality, you should sell that fund and buy a passive index ETF. Why pay a fee for an underperforming fund. Right?
That decision would have cost you dearly coming out of the financial crisis.
As is always the case, a ramping bull market hides investor mistakes – it is the bear market that reveals them. However, it is psychology and fees that are the leading causes of underperformance during a bull market advance.
Investors need to be cognizant of, and understand why, the chorus of arguments in favor of short-sighted and flawed strategies are so prevalent. The meteoric rise in passive investing is one such “strategy” sending an important and timely warning.
Just remember, everyone is “passive” until the selling begins.
Net Positioning
Prior to 1991, the Commodity Futures Trading Commission (CFTC) compiled the Commitments of Traders Report (COT Report) once a month. This data reflected the three major trading groups positions as of the last trading day of the month and was released to the public 3-5 days later electronically and 10-15 days later by printed report. Then, from 1/91 to 10/92, the CFTC compiled the COT Report twice a month reflecting the holdings on the 15th of the month and the last trading day of the month. Again, the data was released days later to the public.
Beginning on 10/16/92 to the present, the CFTC compiles the data weekly reflecting the holdings as of the close of each Tuesday. This data is released electronically to the public every Friday at 3:30 P.M and covers the holdings as of the previous Tuesday.
COT data is exceptionally important data as it is the sole source of the actual holdings of the three key commodity-trading groups, namely:
- Commercial Traders: this group consists of traders that use futures contracts for hedging purposes and whose positions exceed the reporting levels of the CFTC. These traders are usually involved with the production and/or processing of the underlying commodity.
- Non-Commercial Traders: this group consists of traders that don’t use futures contracts for hedging and whose positions exceed the CFTC reporting levels They are typically large traders such as clearinghouses, futures commission merchants, foreign brokers, etc.
- Small Traders: the positions of these traders do not exceed the CFTC reporting levels, and as the name implies, these are usually small traders.
The data we are interested in is the second group of Non-Commercial Traders. This is the group that speculates on where they believe the market is headed. While you would expect these individuals to be “smarter” than retail investors, we find they are just as subject to human fallacy and “herd mentality” as everyone else.
Therefore, as shown in the series of charts below, we can take a look at their current net positioning (long contracts minus short contracts) to gauge excessive bullishness or bearishness on the S&P 500, VIX, Crude Oil, US Dollar and 10-Year Treasury Bonds. With the exception of the 10-Year Treasury which I have compared to interest rates, the others have been compared to the S&P 500.
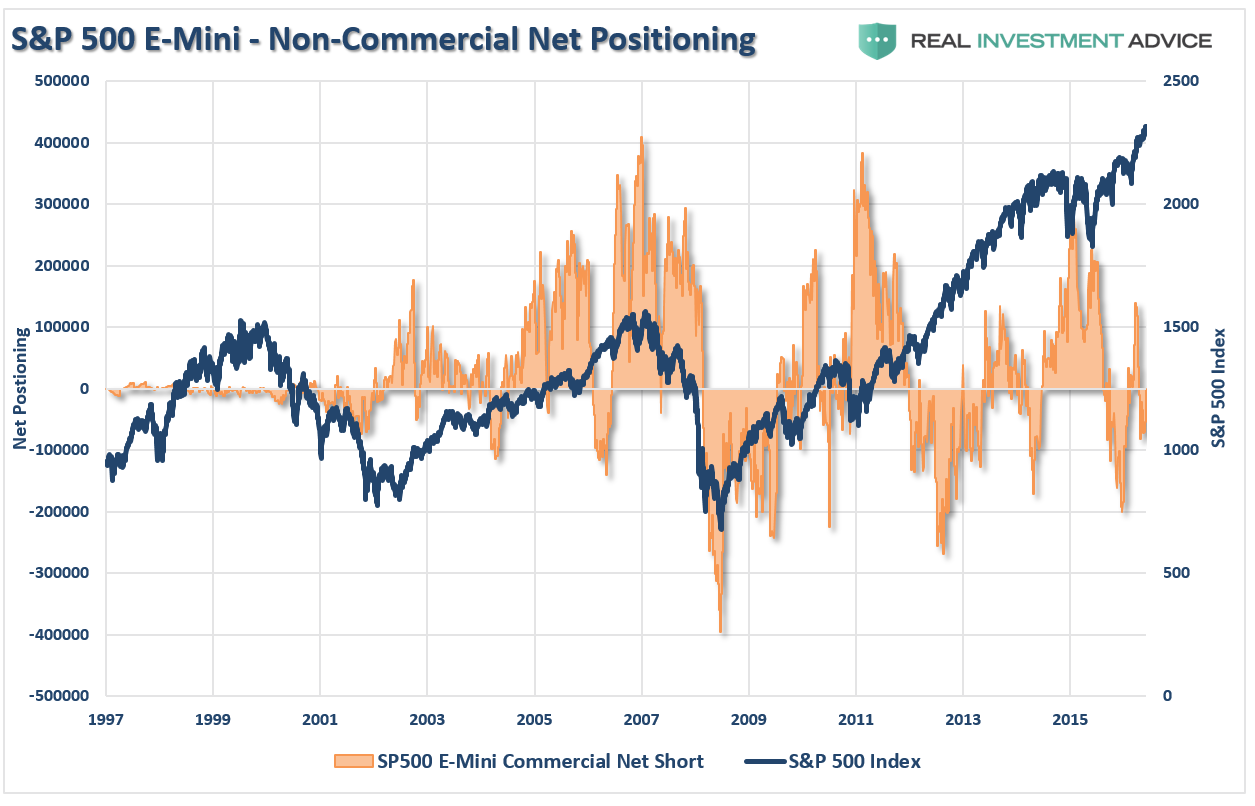
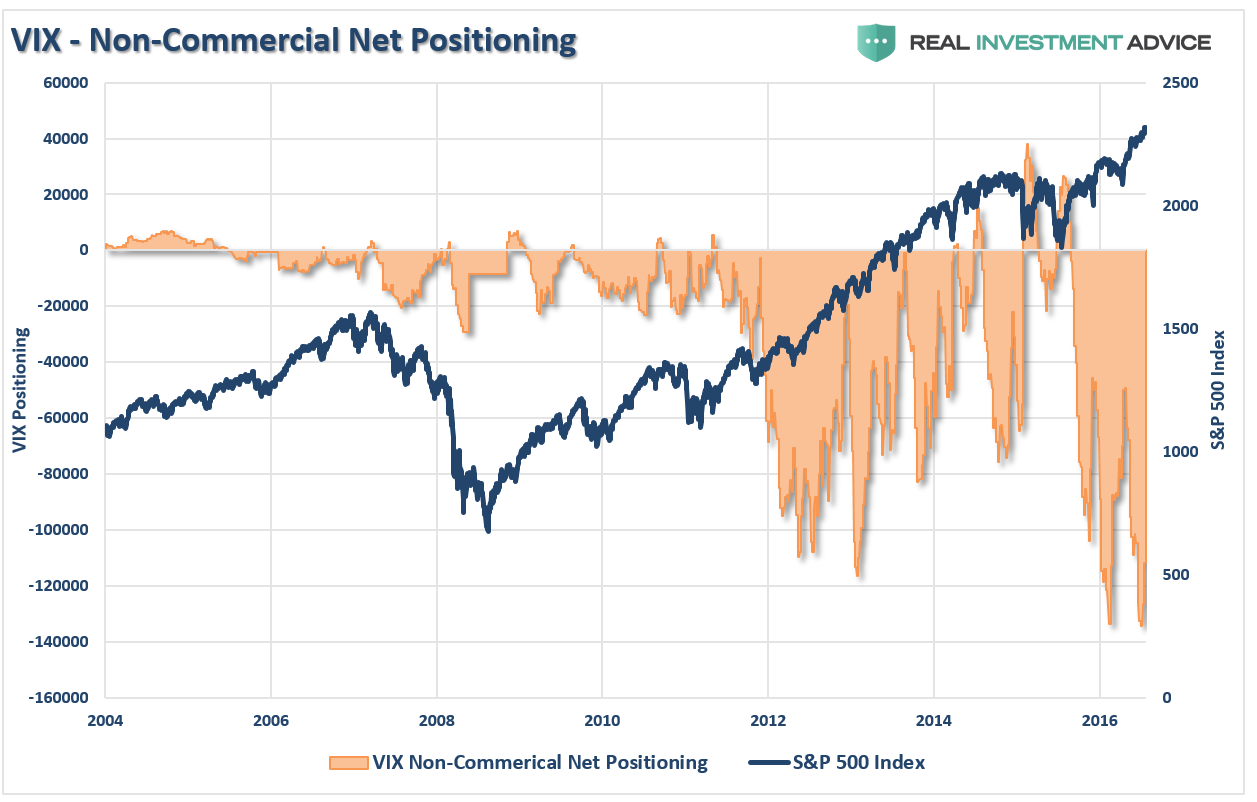

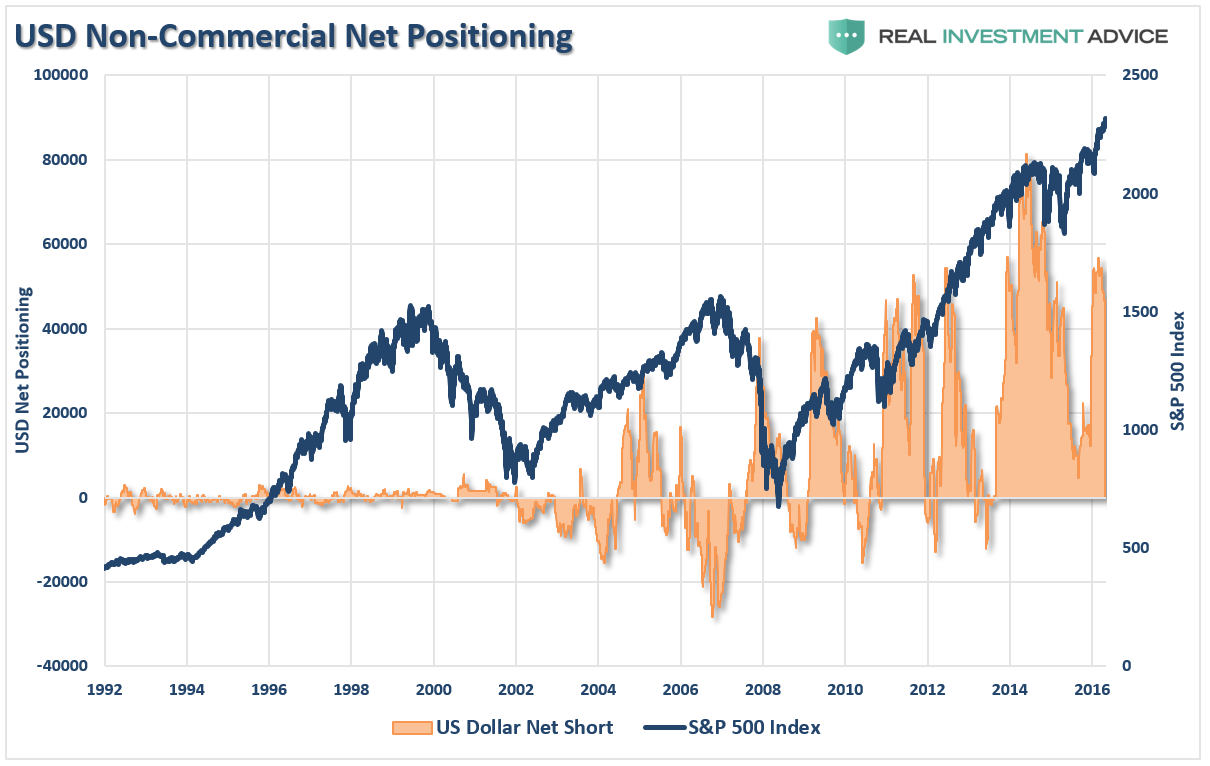
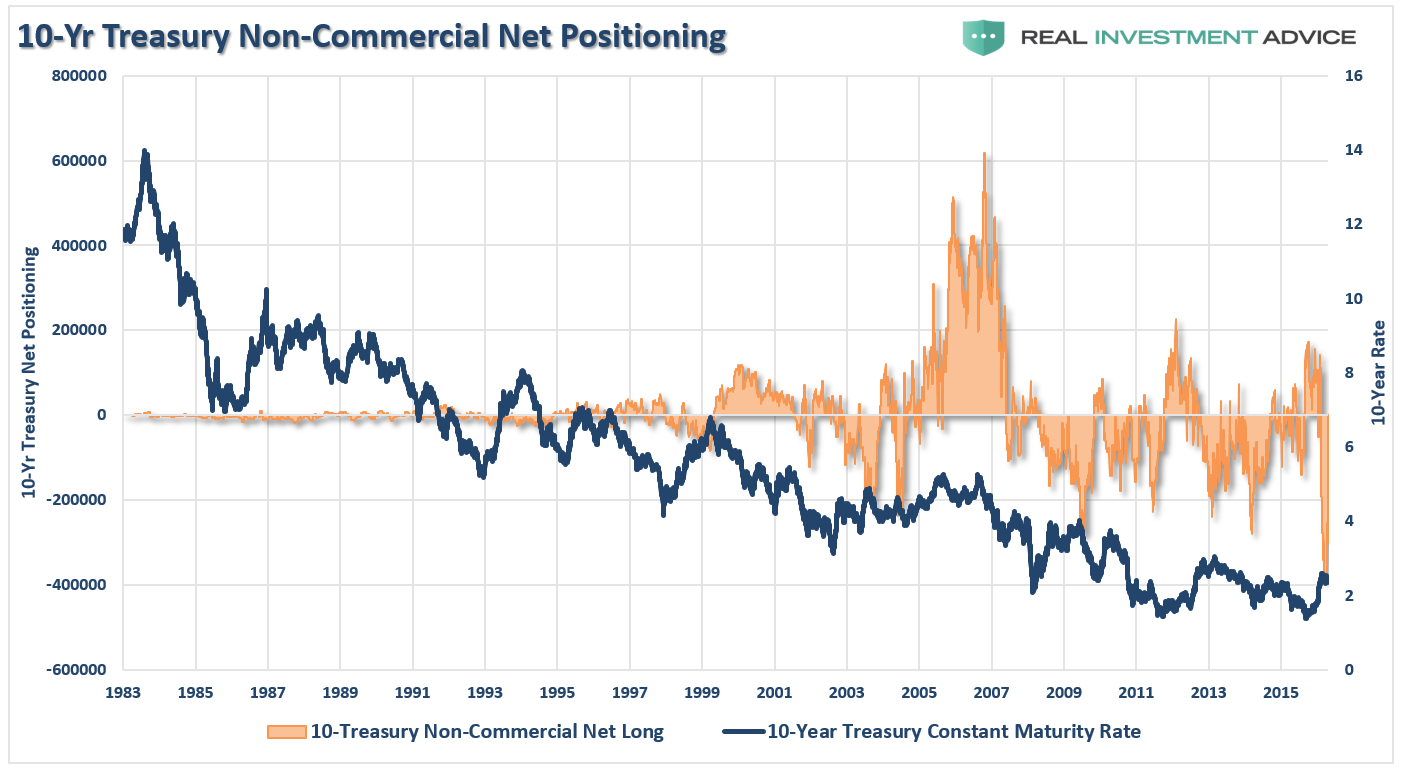
With the exception of the S&P 500, which is currently building a net short position which has usually denoted short-term market tops, the speculative positioning in the other major categories are extremely “crowded trades” currently. Historically, when the herd is eventually flushed in the opposite direction, the selling becomes a “stampede” to reverse positioning.
The only question is “what” will be the trigger.
Buying Panic
The market has been surging higher since the beginning of the month based on the “hopes” of a “terrific” tax reform package from the Trump administration. As investors “rush to get in,” the issue of “risk” has now become an antiquated notion.
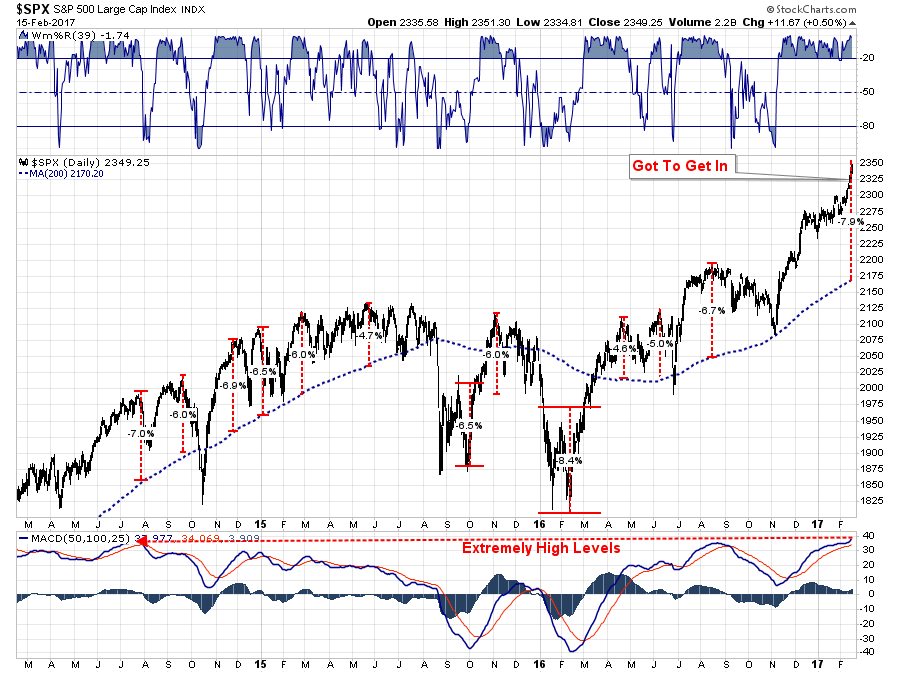
With the market currently trading almost 8% above the 200-dma, the risk of a “reversion” to the mean is obviously nothing to worry about, right?
Maybe not so fast. The chart below shows the very similar technical setup of the market going into the peak of the market in 2007.

I don’t need to remind you what happened next.
Even if tax cuts come through, they won’t impact the market until 2018. And according to Credit Suisse, there is still a problem:
“Investors have been asking how valuations look on 2018 EPS, when it is becoming more likely … that stock market friendly policy changes in Washington could materialize. On current 2018 expectations, US stocks still look highly overvalued.”
The charts below trace forward-looking price-to-earnings ratios all the way back to the mid-1980s:
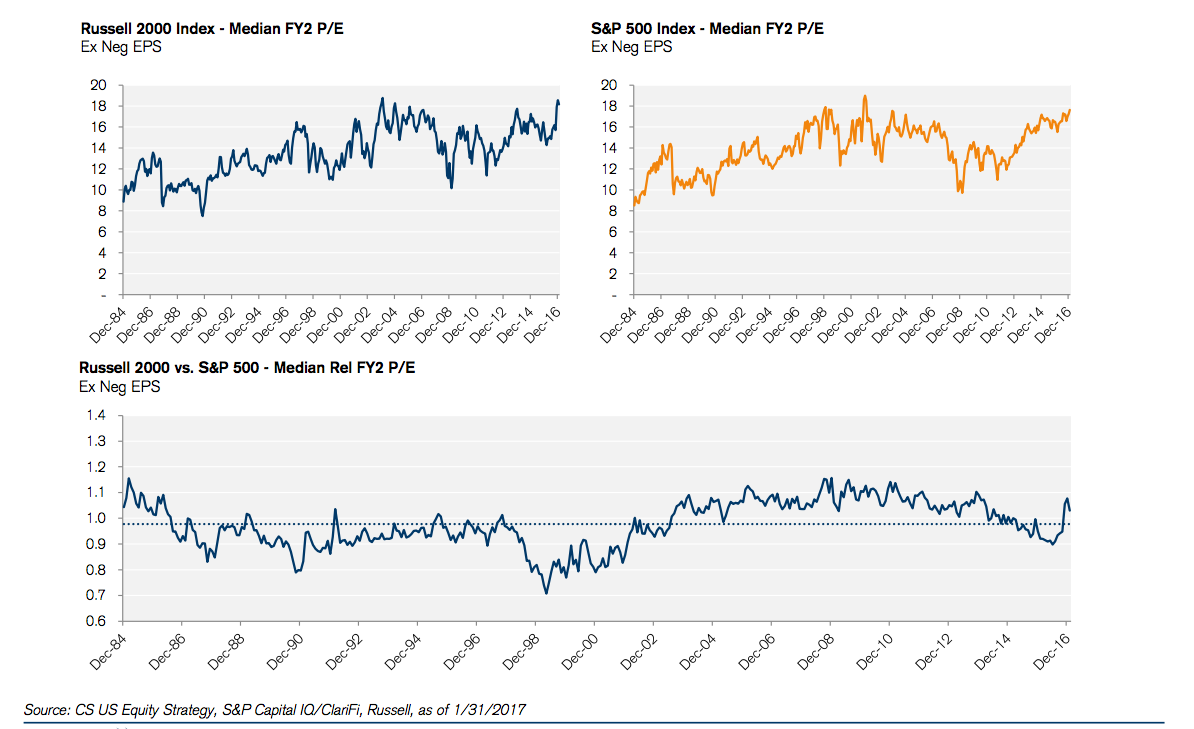
Given that Wall Street has given up the difficult work of picking stocks and making models, of calling experts and building theories, and are now just trading on “Trump Tweets,” what could possibly go wrong?
Just some things I am thinking about.
Lance Roberts

Lance Roberts is a Chief Portfolio Strategist/Economist for Clarity Financial. He is also the host of “The Lance Roberts Show” and Chief Editor of the “Real Investment Advice” website and author of “Real Investment Daily” blog and “Real Investment Report“. Follow Lance on Facebook, Twitter and Linked-In
Copyright © Clarity Financial