For this weeks edition of the SIA Equity Leaders Weekly, we are going to take a look at the number two ranked asset class within the SIA Asset Class Rankings: International Equity. We are going to dissect and analyze this very broad market, specifically looking at the Developed and then the Emerging markets through ETFs.
Ever since early December 2016 when International Equity moved up one spot, both components have been strong which has allowed it to hold that second ranking. SIA's analysis allows subscribers to analyze a step further to see specifically where the main strength is coming from. Viewing a relative strength comparison chart (EFA vs. EEM for example) over these past few months shows a clear victor with the Emerging markets outperforming the Developed markets. Give us a call if you are unsure how to do this or would like to learn more about how to see strength in International Equity or other Asset Classes.
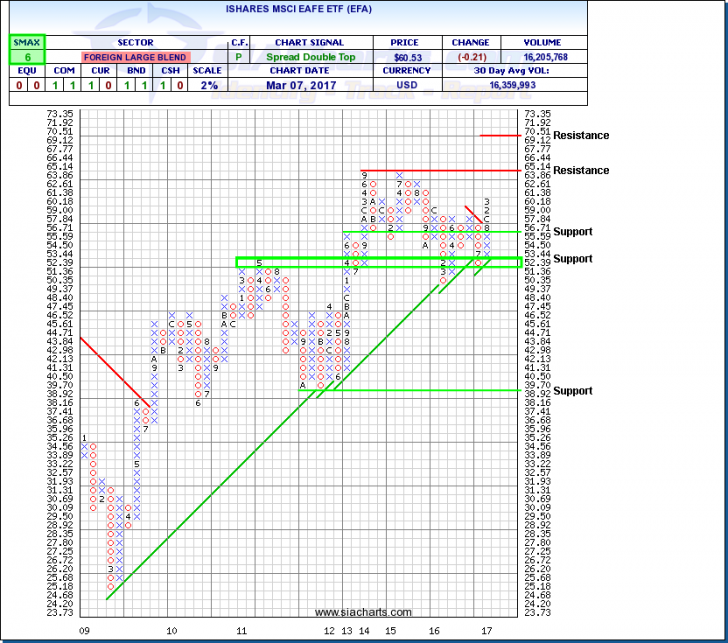
iShares MSCI EAFE ETF (EFA)
The iShares MSCI EAFE ETF (EFA) tracks a broad range of companies (900+) in Europe, Australia, Asia, and the Far East. The exposure to large and mid-capitalization equities from 21 developed markets outside North America give investors an easy way to diversify internationally.
As we can see in the chart, EFA has been on an upwards trend since mid-2009; YTD the shares are up 4.85%. Over this time, there have been some large pullbacks, periods of consolidation, and the recent rally taking place looks to possibly test very strong resistance at the $65 level. It was this same level where the 2013 – 2014 rally topped out and later to be tested unsuccessfully in 2015. Above that level will put the index into historical highs and next resistance level could be found at around $70.
To the downside, support can be found around $55, lower at $51-52, and much further below this below $40. With an SMAX of 6, EFA is showing near-term strength against the asset classes. For those looking to dig deeper to see where specific strength is coming from within the Developed Markets, we recommend checking out the "SIA International Equity Developed Markets ETF Report" to see which specific Developing nations are providing the best relative strength.
Click on Image to Enlarge
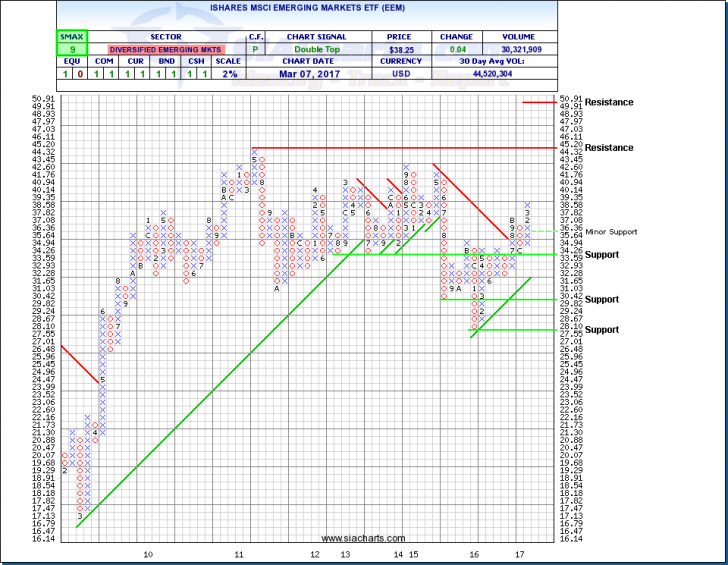
iShares MSCI Emerging Markets ETF (EEM)
The second comparison chart we are going to look at today is the iShares MSCI Emerging Markets ETF (EEM) which follows 800+ large and mid-capitalization stocks from 21 Emerging market country indexes. This ETF gives investors exposure to countries such as China, Korea, Taiwan, India, Brazil, South Africa, and Russia.
Unlike the above chart, the trend of this ETF since its rebound in 2009 ran out of momentum in mid-2011 and formed a consolidation pattern which 5 years later is still in place. Over the past year though, a resurgence seems to be taking place, and YTD the shares are up over 9%. Further strength through $40 could find strong overhead resistance at $45; this being the all-time high level from back in 2011.
To the downside, support levels can be found around $33, $30, and lower at $27.55. With an SMAX of 9, EEM is showing near-term strength against the asset classes. For those looking for ideas within the Emerging Markets to see where this strength is coming from, we recommend checking out the "SIA International Equity Emerging Markets ETF Report" to see which specific Emerging nations are providing the best relative strength and upside going forward.
Click on Image to Enlarge
SIACharts.com specifically represents that it does not give investment advice or advocate the purchase or sale of any security or investment. None of the information contained in this website or document constitutes an offer to sell or the solicitation of an offer to buy any security or other investment or an offer to provide investment services of any kind. Neither SIACharts.com (FundCharts Inc.) nor its third party content providers shall be liable for any errors, inaccuracies or delays in content, or for any actions taken in reliance thereon.
For a more in-depth analysis on the relative strength of the equity markets, bonds, commodities, currencies, etc. or for more information on SIACharts.com, you can contact our sales and customer support at 1-877-668-1332 or at siateam@siacharts.com.
Copyright © SIACharts.com