Focus on Fundamentals
by Burt White, Chief Investment Officer, LPL Financial
Key Takeaways
- At times of uncertainty we suggest investors focus on the fundamentals of the economy and corporate profits.
- Like everyone else, we don’t know what will happen with the Russia investigation, although we have made some observations about what the latest news could mean for fiscal policy.
- We have a better handle on the basic fundamentals, which look pretty good right now and tend to drive stocks over time.
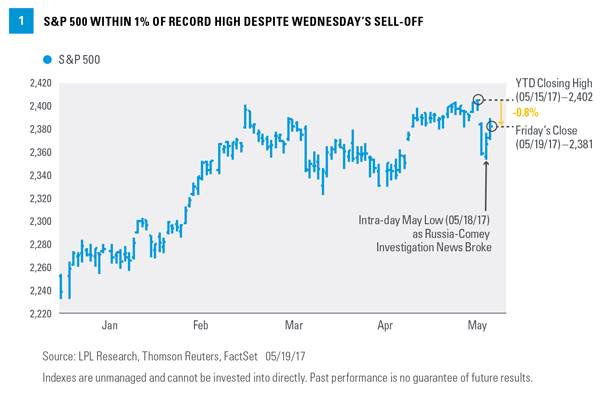
What are we telling our investors? Focus on fundamentals. It was an up-and-down week for stocks as market participants became increasingly worried that the Trump administration’s agenda was in danger following the latest news surrounding the Russian investigation. On Wednesday (May 17), the S&P 500 Index suffered its biggest one-day drop in nearly a year (-1.8%), while the Nasdaq Composite (-2.6%) and Russell 2000 Index (-2.8%) suffered even bigger losses.
Stocks then recovered nicely Thursday and Friday (May 18-19) to end the week with only a modest loss, the S&P 500 falling 0.4% for the week. As hard as it is to believe, the index is still less than 1% off its all-time closing high [Figure 1]. Some attributed the late-week rebound to the market’s approval of former FBI Director Robert Mueller as special counsel for the Russia investigation. Perhaps markets got more comfortable with where the investigation might lead. More good economic and earnings data probably helped; it’s difficult to know. But whatever the reason for the rebound, this week we focus on the market’s fundamentals which look pretty good.
Focus on Fundamentals
Regarding the Russia situation, we are still in the headline risk stage. We just don’t know what is going to happen. At times of uncertainty, especially the political variety, we suggest investors focus on the fundamentals of the economy and corporate profits, as we do below. At this point we believe the likelihood that headline risk will become fundamental risk is low.
Macro Picture Continues To Improve
The macro picture looks good. We are not seeing any concerning recessionary warning signs and, despite the weak start in the first quarter, still see a pickup in economic growth this year from the 2% pace of the past eight years. We see U.S. gross domestic product (GDP) growth near 2.5% in 2017, and it may even exceed that pace in the current (second) quarter*. The Conference Board Leading Economic Index, released last week, continues to signal a low probability of recession over the next 12-18 months. Confidence among businesses and consumers is still high, which we think will translate into faster growth. Job gains have been steady, supporting wage increases and consumer spending. Capital spending has picked up some in recent months, as energy markets have stabilized. And the U.S. dollar has been falling, supporting U.S. exports and overseas earnings for multinational corporations.
* Our forecast for GDP growth of between 2.5–3% is based on the historical mid-cycle growth rate of the last 50 years. Economic growth is affected by changes to inputs such as: business and consumer spending, housing, net exports, capital investments, and government spending.
Earnings Outlook Brightening
The earnings picture has brightened recently, supported by a firming U.S. economy and capped off by a very strong first quarter earnings season. Not only did the S&P 500 produce 5% upside to quarter-end (04/01/17) consensus estimates, but estimates for the balance of 2017 hardly budged during the reporting season (a rare and positive occurrence) and 2018 estimates have actually inched higher.
The earnings picture right now is as good as it has been in a while, with 2017 positioned to bring solid gains after flat earnings over the past three years; we think the improved earnings outlook has the potential to push stocks higher between now and year-end even without any policy impact. Policy matters, but its potential impact on earnings is a 2018 story. Should the market’s optimism about reforms in 2018 rise, stock valuations may be pushed higher later this year in anticipation of the earnings bump.
Little, if any, sign of credit stress
We have not seen signs of stress in the fixed income markets that might suggest some deterioration in the fundamental outlook for stocks. Corporate credit spreads on high-yield and investment-grade credit remain narrow. Financial conditions have eased, based on the Federal Reserve Bank of Chicago’s National Financial Conditions Index (financial deregulation prospects may have something to do with that). The yield curve flattened a bit this week, and the 10-year Treasury yield fell 10 basis points (0.10%), but these levels are nowhere near those that would suggest stress in credit markets. Although some of the economic data slowed in the spring and pushed U.S. Treasury yields lower, we are not concerned that lower yields signal a pronounced or sustained economic slowdown given evidence of a potential pickup in the second quarter.
Fiscal Fallout
We advise focusing on the fundamentals, as we have done above. But fiscal policy, and particularly tax reform, is part of the fundamental story—with the potential to add to economic growth and profits in 2018 and beyond. So while predicting the outcome of the Russia investigation is difficult, we can make some observations:
Hopes for major policy achievements in 2017 have come seriously into question, and the latest controversies increase the odds that corporate tax reform gets pushed into 2018. The possibility exists that reform gets scaled down and becomes just tax cuts and a lower tax rate for repatriating overseas profits, which would still be expected to drive more capital spending and profits in 2018.
The latest distractions may light a fire under Republicans increasingly desperate for a “win.” The political costs of potential failure on healthcare (which also faces a difficult road) and tax reform are high. This may explain why an infrastructure proposal is likely coming within several weeks.
Republicans may fear their majority in the House is at risk, pushing them to accelerate their timetable. The tight-lipped special counsel may actually help the Republican policymakers compartmentalize and focus.
Distractions may slow the pace of staffing up key regulatory agencies and could therefore slow the pace of financial regulatory reform, a key pillar of the Trump administration’s agenda.
Technical Perspective
From a technical perspective, we see support at around the 2320 level on the S&P 500 (roughly 60 points or 2.6% below Friday’s close). The magnitude of Wednesday’s sell-off was certainly jarring, especially given how long it has been since the S&P 500 dropped more than 1% in a day. The rally late in the week off the Thursday morning lows was encouraging, as has been the stock market’s tendency to recover from sharp one-day declines when the S&P 500 has been near all-time highs. We also like seeing the S&P 500’s break back above its 50-day moving average which, from a technical perspective, tends to be a positive signal (the index is now above its 50-, 100-, and 200-day moving averages).
These are positive signs, but from a technical perspective, it would be nice to see the broad market settle down for a few days before potentially putting fresh money to work.
Conclusion
Like everyone else, we don’t know what will happen with the Russia investigation, although we have made some observations about what the latest news could mean for fiscal policy. We have a better handle on the basic fundamentals of the economy and corporate profits, which look pretty good right now, tend to drive stocks over time, and are where we think investors should be focused.
*****
IMPORTANT DISCLOSURES
The opinions voiced in this material are for general information only and are not intended to provide specific advice or recommendations for any individual. To determine which investment(s) may be appropriate for you, consult your financial advisor prior to investing. All performance referenced is historical and is no guarantee of future results.
The economic forecasts set forth in the presentation may not develop as predicted and there can be no guarantee that strategies promoted will be successful.
Investing in stock includes numerous specific risks including: the fluctuation of dividend, loss of principal, and potential liquidity of the investment in a falling market.
Government bonds and Treasury bills are guaranteed by the U.S. government as to the timely payment of principal and interest and, if held to maturity, offer a fixed rate of return and fixed principal value. However, the value of fund shares is not guaranteed and will fluctuate.
Corporate bonds are considered higher risk than government bonds but normally offer a higher yield and are subject to market, interest rate, and credit risk as well as additional risks based on the quality of issuer coupon rate, price, yield, maturity, and redemption features.
High-yield/junk bonds are not investment-grade securities, involve substantial risks, and generally should be part of the diversified portfolio of sophisticated investors.
All investing involves risk including loss of principal.
Yield curve is a line that plots the interest rates, at a set point in time, of bonds having equal credit quality, but differing maturity dates. The most frequently reported yield curve compares the 3-month, 2-year, 5-year and 30-year U.S. Treasury debt. This yield curve is used as a benchmark for other debt in the market, such as mortgage rates or bank lending rates. The curve is also used to predict changes in economic output and growth.
INDEX DESCRIPTIONS
The Standard & Poor’s 500 Index is a capitalization-weighted index of 500 stocks designed to measure performance of the broad domestic economy through changes in the aggregate market value of 500 stocks representing all major industries.
The Leading Economic Index is a monthly publication from the Conference Board that attempts to predict future movements in the economy based on a composite of 10 economic indicators whose changes tend to precede changes in the overall economy.
The National Financial Conditions Index (NFCI) measures risk, liquidity and leverage in money markets and debt and equity markets as well as in the traditional and “shadow” banking systems. Positive values of the NFCI indicate financial conditions that are tighter than average, while negative values indicate financial conditions that are looser than average.
The NASDAQ Composite Index measures all NASDAQ domestic and non-U.S.-based common stocks listed on the NASDAQ stock market.
The Russell 2000 Index is an unmanaged index generally representative of the 2,000 smallest companies in the Russell Index, which represents approximately 10% of the total market capitalization of the Russell 3000 Index.