by Don Vialoux, Timingthemarket.ca
The Bottom Line
U.S. equity markets surprisingly reached record levels last week, but returned to short and intermediate overbought levels. Much of the strength in U.S. equity markets occurred in a small number of big cap stocks (FANG stocks plus Apple). Seasonal influences for world equity markets in the month of June have a history of showing strength, but at a diminished level as they approach a seasonal peak in mid-June. Seasonal influences remain positive in selected sectors (Biotech, Health Care Equipment, Aerospace, Health Care Providers). Accordingly, caution in equity markets continues to be supported.
Economic News This Week
April Personal Income to be released at 8:30 AM EDT on Tuesday is expected to increase 0.4% versus a gain of 0.2% in March. April Personal Spending is expected on increase 0.4% versus no change in March.
March Case/Shiller 20 City Home Price Index is released at 9:00 AM EDT on Tuesday.
May Consumer Confidence to be released at 10:00 AM EDT on Tuesday is expected to slip to 118.3 from 120.3.
Canadian First Quarter Real GDP to be released at 8:30 AM EDT on Wednesday is expected to grow at a 4.3% annual rate versus a 2.6% rate in the fourth quarter of 2016. On a month-over-month basis March GDP is expected to grow at a 0.3% versus no change in February.
May Chicago PMI is released at 9:45 AM EDT on Wednesday.
Beige Book is released at 2:00 PM EDT on Wednesday
May ADP Private Employment Report is released at 8:15 AM EDT on Thursday
Weekly Jobless Claims are released at 8:30 AM EDT on Thursday.
May ISM to be released at 10:00 AM EDT on Thursday is expected to increase to 55.0 from 54.8 in April
April Construction Spending to be released at 10:00 AM EDT on Thursday is expected to increase 0.6% versus a drop of 0.2% in March.
May Non-farm Payrolls to be released at 8:30 AM EDT on Friday are expected to slip to 190,000 from 212,000 in April. May Unemployment Rate is expected to remains unchanged from April at 4.4%. May Hourly Earnings are expected to increase 0.3% versus a gain of 0.3% in April.
U.S. April Trade Deficit to be released at 8:30 AM EDT on Friday is expected to increase to $46.7 billion from $43.7 billion in March.
Canadian April Merchandise Trade Balance to be released at 8:30 AM EDT on Friday is expected to be a surplus of $100 million versus a deficit of $100 million in March
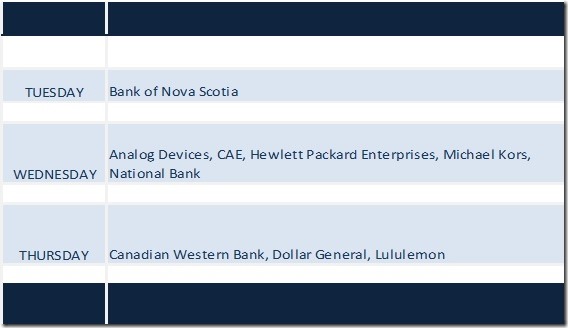
Earnings Calendar This Week
Observations
Technical action by individual S&P 500 stocks turned positive last week: 68 stocks broke intermediate resistance levels and 25 stocks broke intermediate support. Notable sectors with upside breakouts were Consumer Discretionary, Consumer Staples, Health Care, Industrials and Technology. Notable sector with downside breakdowns was Energy. Number of S&P 500 stocks in an intermediate uptrend increase last week to 259 from 248, number of stock in a neutral trend slipped to 50 from 52 and number of stocks in a downtrend increased to 191 from 200. The Up/Down ratio increased last week to (259/191=) 1.36 from 1.24. The ratio peaked on March 1st at (350/119=) 2.94.
Economic news in Canada and the U.S. generally are expected to show slightly accelerated growth from the first quarter. Focus is on the U.S. employment report on Friday.
First quarter report season is winding down in the U.S. and Canada. Earnings focus this week remains on Canada’s banks.
Technical action by short term technical indicators (Momentum/Above-Below 20 day moving average) turned positive last week for most equity markets and sectors (exception was commodities and commodity sensitive stocks). Indicators generally have returned to overbought levels, but have yet to show signs of peaking.
Intermediate technical indicators (Percent trading above their 50 day moving average, Bullish Percent Index) generally moved higher last week to more overbought levels. Some continue to trend lower (notably TSX indicators)
First quarter reports by S&P 500 companies are near an end: 98% of companies have reported to date. 75% of reporting companies exceeded consensus earnings and 64% beat consensus sales. Blended earning on a year-over-year basis increased 13.9% and blended sales increased 7.7%. Another six S&P 500 companies are scheduled to release quarterly results this week.
The outlook for S&P 500 companies remains promising. 73 companies have issued negative second quarter guidance and 36 companies have issued positive guidance. Consensus earnings and sales estimates were virtually unchanged from last week. According to FactSet, second quarter earnings on a year-over-year basis are expected to increase 6.8% while sales are expected to increase 4.9%. Third quarter earnings are expected to increase 7.5% while sales are expected to increase 5.1%. Fourth quarter earnings are expected to increase 12.4% while sales are expected to increase 5.2%. For 2017, earnings are expected to increase 10.0% while sales are expected to increase 5.4%. All earnings and sales estimates were unchanged from last week.
Geopolitical events continue to influence equity markets. Response to the G7 meeting is expected to be reflected in North American equity markets today. Other events to watch include continuing political instability in North Korea, Brazil and Venezuela and the tightening polls prior to the June 6th election in the United Kingdom. Add the daily “leak” to the media about the Trump Administration.
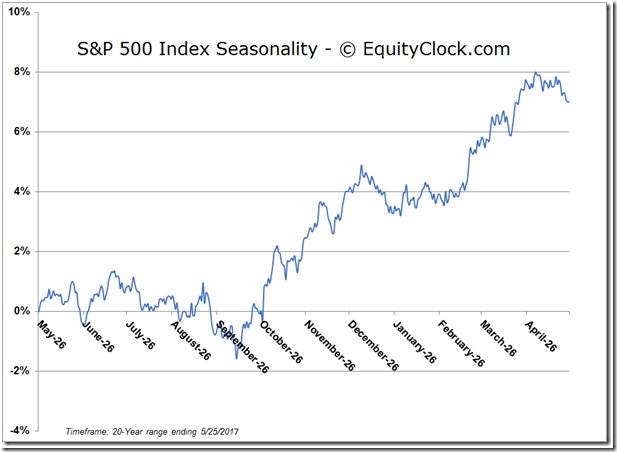
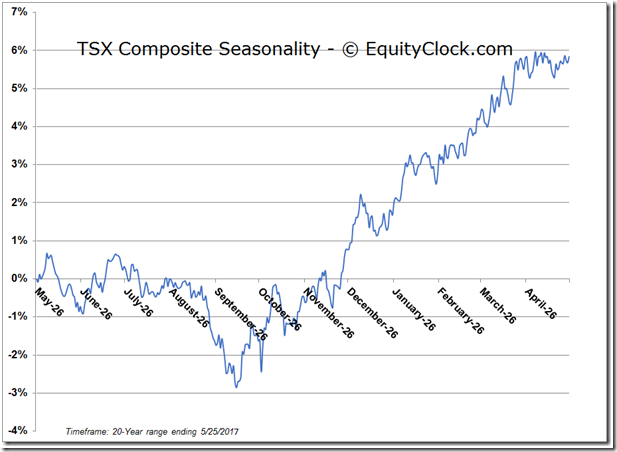
Seasonal Influences by North American equity markets tends to be mixed in the month of June. Long term returns since 1950 indicate an average return per period by the TSX Composite and S&P 500 Index near zero. On average during the past 20 periods, the TSX Composite Index has reached a seasonal peak on or about June 9th and a second peak in mid-July. Frequently, the S&P 500 Index has reached a peak near June 15th with a second peak in mid-July. Momentum spikes frequently occur in the June /mid-October period. Spike by the VIX Index two weeks ago proved to be a false alarm. However, short term overbought conditions and unsettling political conditions continue to suggest watchful waiting. If an upside surprise occurs in North American equity indices, it likely will happen late in June/early July coinciding with the seasonal Independence Day trade. Sectors with the best track records in the month of June during the past 20 periods include Health Care and Technology (particularly Software and Services). Sectors with the weakest track records include Materials (particularly Chemicals), Home builders and U.S. Banks.
Equity Indices and Related ETFs
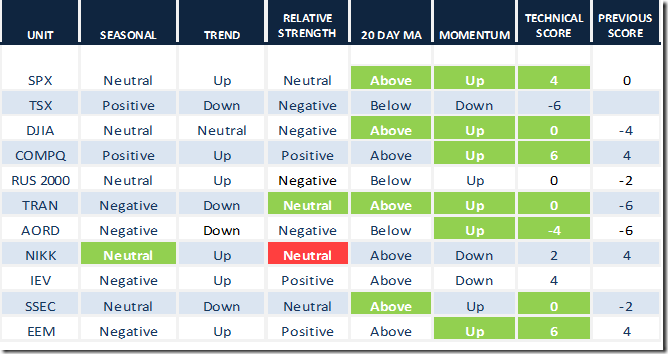
Daily Seasonal/Technical Equity Trends for May 26th 2017
Green: Increase from previous day
Red: Decrease from previous day
Calculating Technical Scores
Technical scores are calculated as follows:
Intermediate Uptrend based on at least 20 trading days: Score 2
Higher highs and higher lows
Intermediate Neutral trend: Score 0
Not up or down
Intermediate Downtrend: Score -2
Lower highs and lower lows
Outperformance relative to the S&P 500 Index: Score: 2
Neutral Performance relative to the S&P 500 Index: 0
Underperformance relative to the S&P 500 Index: Score -2
Above 20 day moving average: Score 1
At 20 day moving average: Score: 0
Below 20 day moving average: -1
Up trending momentum indicators (Daily Stochastics, RSI and MACD): 1
Mixed momentum indicators: 0
Down trending momentum indicators: -1
Technical scores range from -6 to +6. Technical buy signals based on the above guidelines start when a security advances to at least 0.0, but preferably 2.0 or higher. Technical sell/short signals start when a security descends to 0, but preferably -2.0 or lower.
Long positions require maintaining a technical score of -2.0 or higher. Conversely, a short position requires maintaining a technical score of +2.0 or lower.
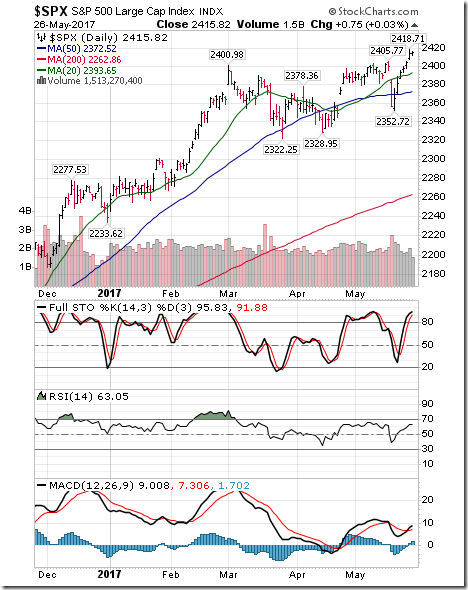
The S&P 500 Index gained 34.09 points (1.43%) last week to an all-time high. Intermediate trend remains up. The Index moved above its 20 day moving average. Short term momentum indicators turned up. Technical score increased last week to 4 from 0.
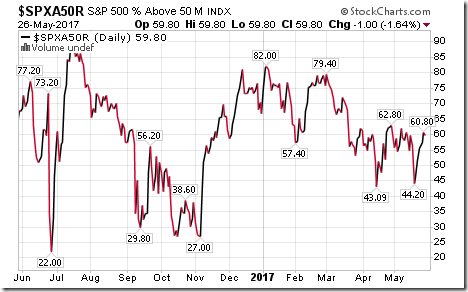
Percent of S&P 500 stocks trading above their 50 day moving average (Also known as the S&P 500 Momentum Barometer) increased last week to 59.80 from 51.60. Percent returned to intermediate overbought.
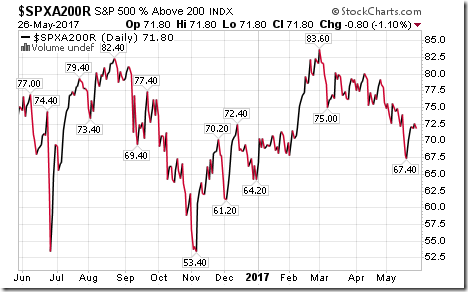
Percent of S&P 500 stocks trading above its 200 day moving average increased last week to 71.80 from 70.00. Percent remains intermediate overbought and trending down.
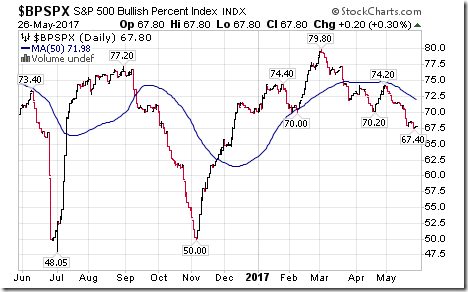
Bullish Percent Index for S&P 500 stocks slipped last week to 67.80 from 68.40 and remained below its 20 day moving average. The Index remains intermediate overbought and trending down.
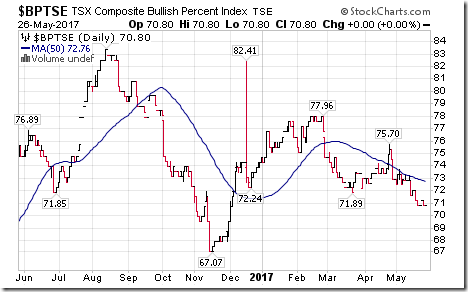
Bullish Percent Index for TSX Composite stocks was unchanged last week at 70.80 and remained below its 20 day moving average. The Index remains intermediate overbought and trending down.
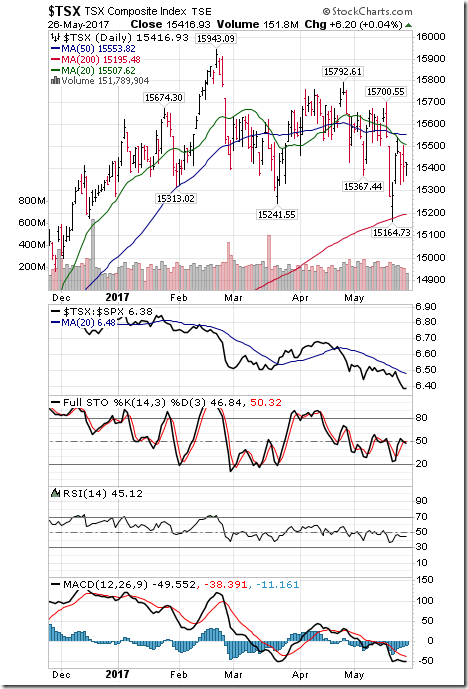
The TSX Composite Index dropped 41.53 points (0.27%) last week. Intermediate trend remained down (Score: -2). Strength relative to the S&P 500 Index remains negative (Score: -2). The Index remained below its 20 day moving average (Score: -1). Short term momentum indicators are trending down (-1). Technical score remained last week at -6.
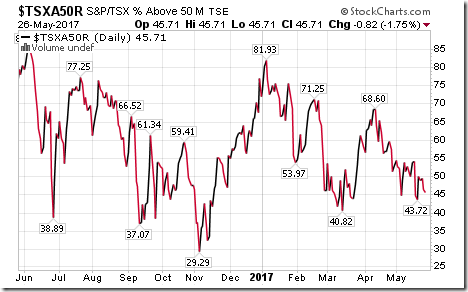
Percent of TSX stocks trading above their 50 day moving average (Also known as the TSX Momentum Barometer) dropped last week to 45.71 from 50.00. Percent remains intermediate neutral and trending down.
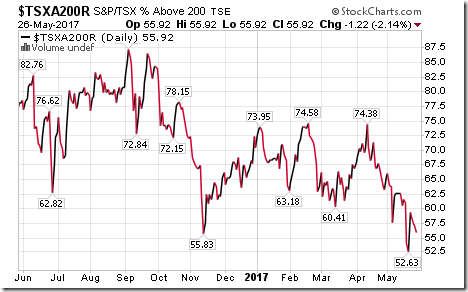
Percent of TSX stocks trading above their 200 day moving average dropped last week to 55.92 from 59.36. Percent remains intermediate overbought and trending down.
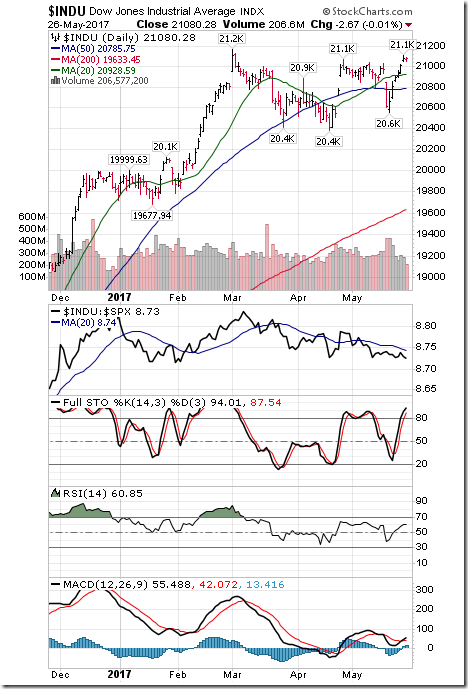
Dow Jones Industrial Average gained 275.44 points (1.32%) last week. Intermediate trend remained at neutral. Strength relative to the S&P 500 Index remained negative. The Average moved above its 20 day moving average. Short term momentum indicators turned up. Technical score increased last week to 0 from –4
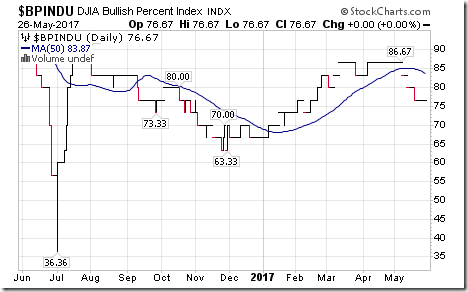
Bullish Percent Index for Dow Jones Industrial Average stocks remained unchanged last week to 76.67 and remained below its 20 day moving average. The Index remains intermediate overbought and trending down.
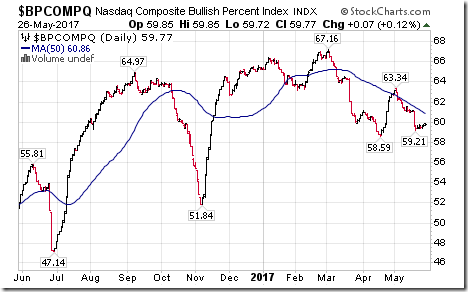
Bullish Percent Index for NASDAQ Composite stocks increased last week to 59.77 from 59.50 and remained below its 20 day moving average. The Index remains intermediate overbought and trending down.
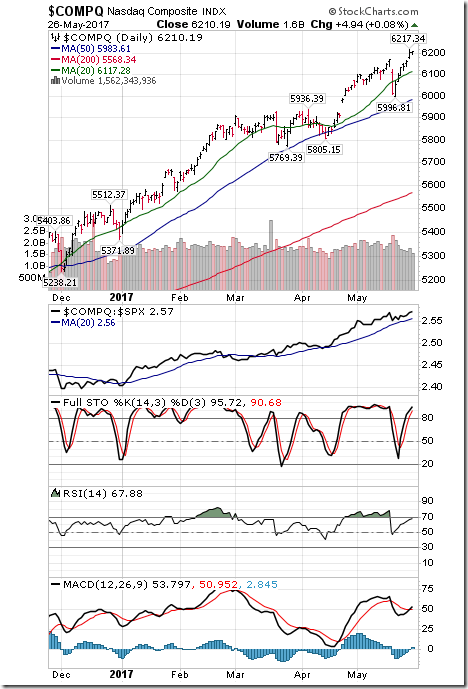
The NASDAQ Composite Index gained 126.49 (2.08%) to another all-time high. Intermediate trend remains up. Intermediate trend remains up. Strength relative to the S&P 500 Index remains positive. The Index remained above its 20 day moving averages. Short term technical indicators turned up. Technical score increased last week to 6 from 4.
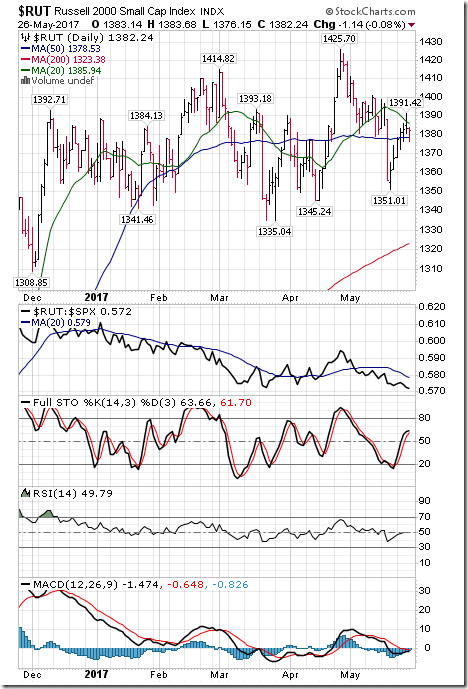
The Russell 2000 Index gained 14.91 points (1.09%) last week. Intermediate trend remains up. Strength relative to the S&P 500 Index remained negative. The Index remained below its 20 day moving average. Short term momentum indicators have turned up. Technical score increased last week to 0 from -2.
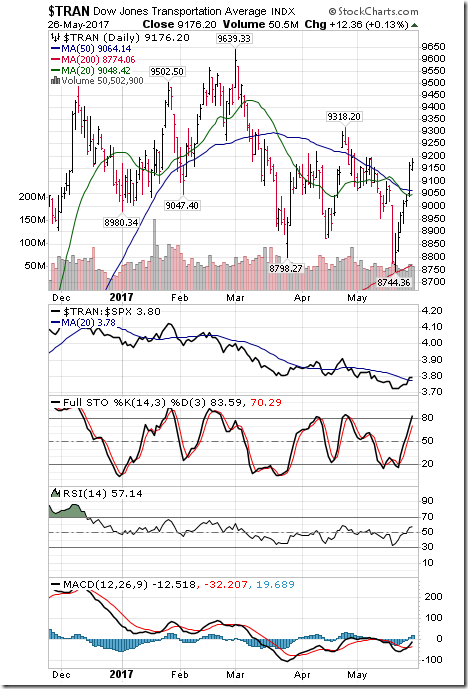
Dow Jones Transportation Average gained 297.01 points (3.35%) last week. Intermediate trend remains down. Strength relative to the S&P 500 Index increased to neutral from negative. The Average moved above its 210 day moving average. Short term momentum indicators are trending up. Technical score increased last week to 0 from -6.
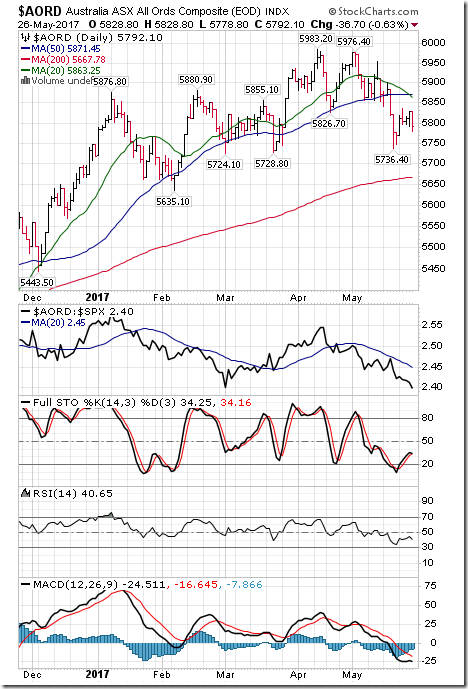
The Australia All Ordinaries Composite Index added 3.20 points (0.06%) last week. Intermediate trend remains down. Strength relative to the S&P 500 Index remains negative. The Index remains below its 20 day moving average. Short term momentum indicators have turned up. Technical score improved last week to -4 from -6.
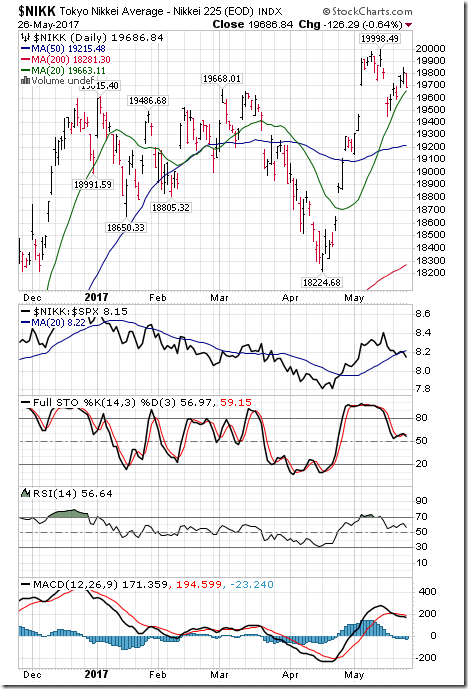
The Nikkei Average gained 96.08 points (0.49%) last week. Intermediate trend remains up. Strength relative to the S&P 500 Index changed to neutral from positive. The Average remains above its 20 day moving average. Short term momentum indicators are trending down. Technical score slipped last week to 2 from 4.
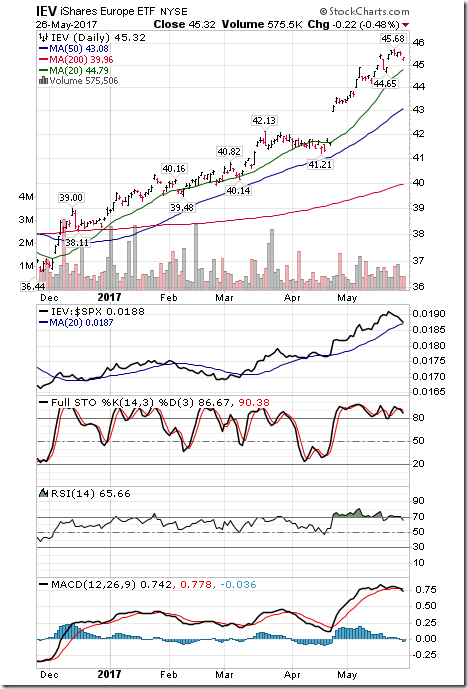
Europe iShares added $0.85 (1.87%) last week Intermediate trend remains up. Strength relative to the S&P 500 Index remains positive. Units remain above their 20 day moving average. Short term momentum indicators have rolled over. Technical score remained last week at 4.
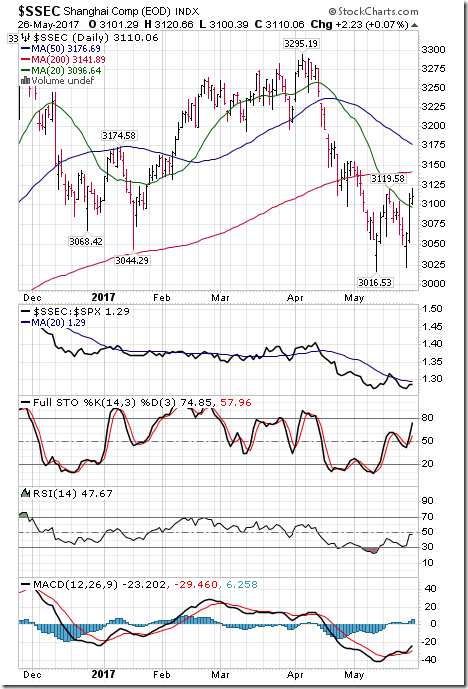
The Shanghai Composite Index gained 19.43 points (0.63%) last week. Intermediate trend remains down. Strength relative to the S&P 500 Index remains neutral. The Index moved above its 20 day moving average on Friday. Short term momentum indicators are trending up. Technical score improved last week to 0 from -2.
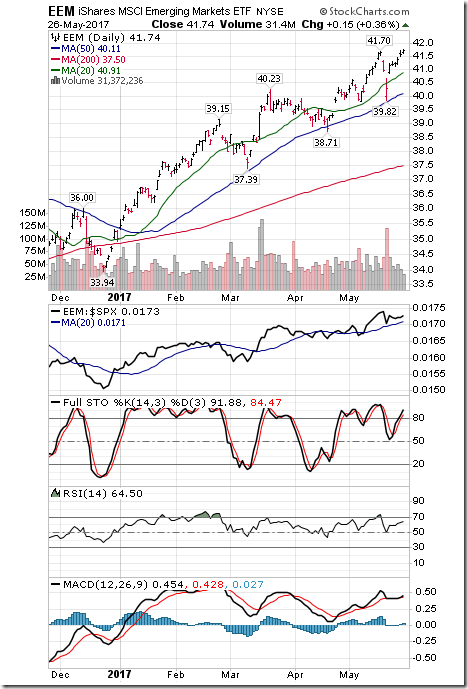
Emerging Markets iShares added $0.59 (1.43%) last week. Intermediate trend remains up. Strength relative to the S&P 500 Index remains positive. Units remain above their 20 day moving average. Short term momentum indicators have turned up. Technical score increased last week to 6 from 4.
Currencies
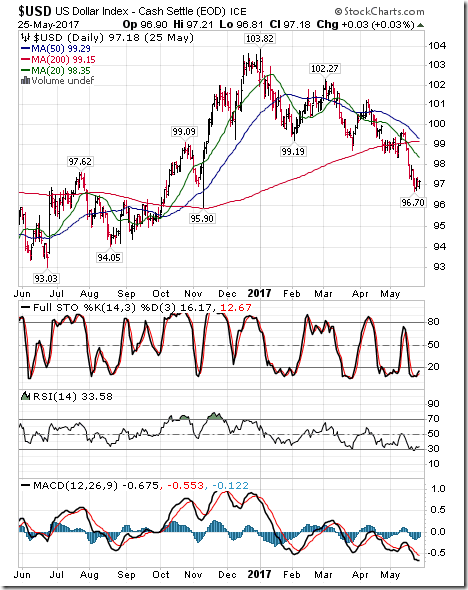
The U.S. Dollar Index dropped another 0.59 (0.60%) last week. Intermediate trend remains down. The Dollar remains below its 20 day moving average. Short term momentum indicators are trending down, but are oversold and showing early signs of bottoming.
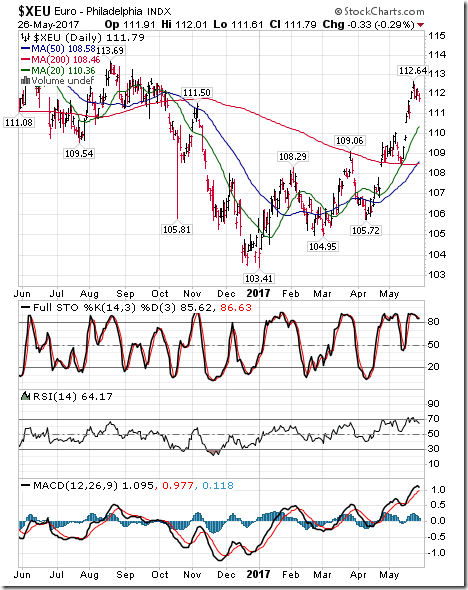
The Euro slipped 0.25 (0.22%) last week. Intermediate trend remains up. The Euro remains above its 20 day moving average. Short term momentum indicators are trending up, but are overbought and showing early signs of rolling over.
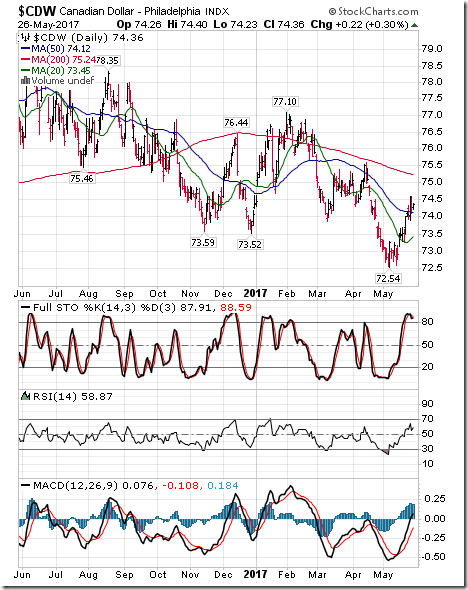
The Canadian Dollar gained US 0.36 cents (0.49%) last week. Intermediate trend remains down. The Canuck Buck remained above its 20 day moving average. Short term momentum indicators are trending up and are overbought.
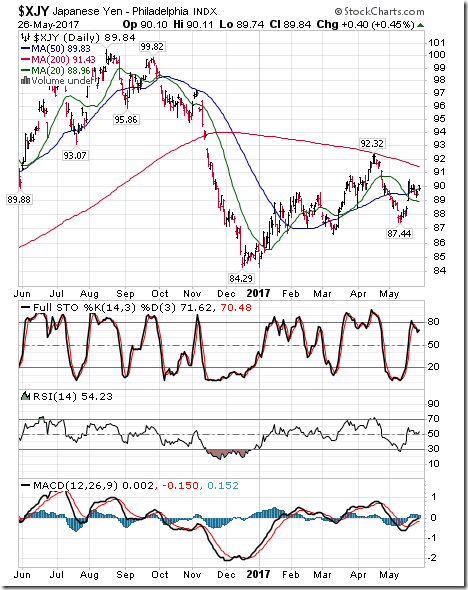
The Japanese Yen slipped 0.05 (0.06%) last week. Intermediate trend remains up. The Yen remained above its 20 day moving average. Short term momentum indicators are trending up, but are overbought.
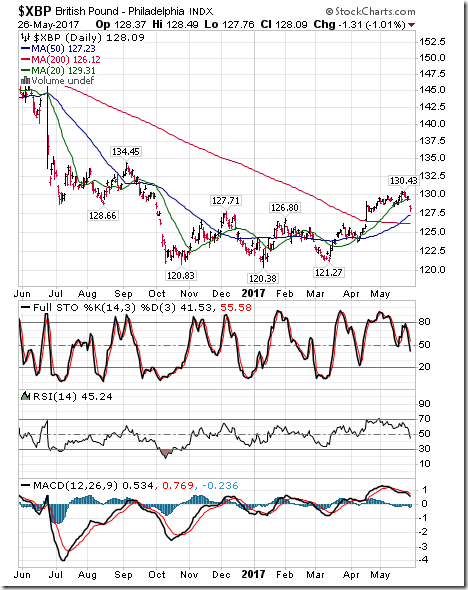
The British Pound dropped 2.25 (1.73%) last week with most of the drop occurring on Friday following election poll results that were tightening. Intermediate trend remains up. The Pound dropped below its 20 day moving average on Friday. Short term momentum indicators are trending down.
Commodities and Related ETFs
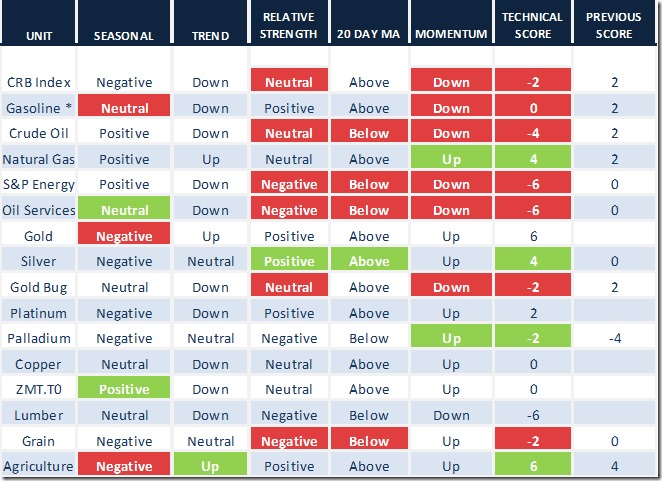
Daily Seasonal/Technical Commodities Trends for May 26th 2017
Green: Increase from previous day
Red: Decrease from previous day
* Excludes adjustment from rollover of futures contracts
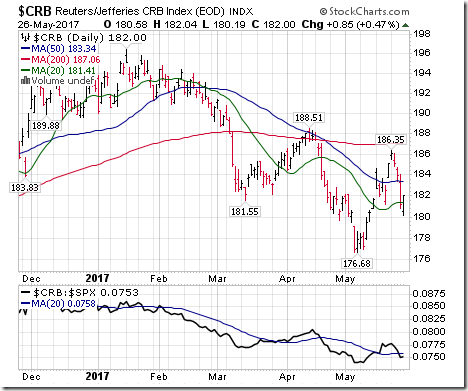
The CRB Index dropped 1.73 points (0.94%) last week. Intermediate trend remains down. Strength relative to the S&P 500 Index changed to neutral from positive. The Index remains above its 20 day moving average. Short term momentum indicators are trending down. Technical score last week dropped to -2 from 2.
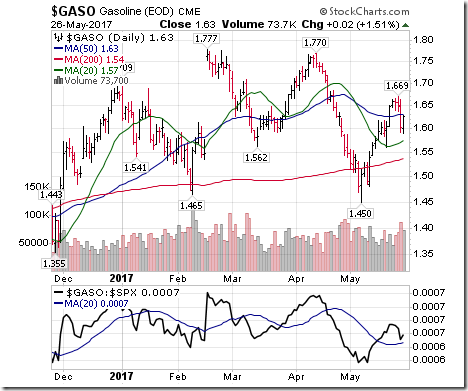
Gasoline slipped $0.02 per gallon (1.21%) last week. Intermediate trend remains down. Strength relative to the S&P 500 Index remains positive. Gas remains above its 20 day moving average. Short term momentum indicators are trending down. Technical score slipped last week to 0 from 2.
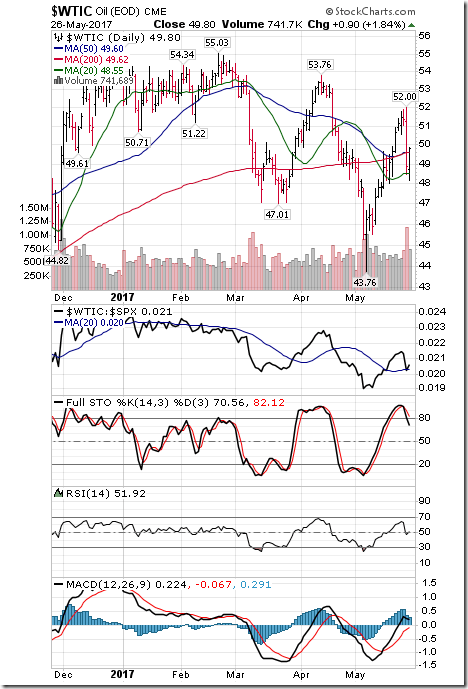
Crude Oil dropped $0.87 per barrel (1.72%) last week. Intermediate trend remains down. Strength relative to the S&P 500 Index changed to neutral from positive. Crude remains above its 20 day moving average. Short term momentum indicators are trending down. Technical score dropped last week dropped to -2 from 2.
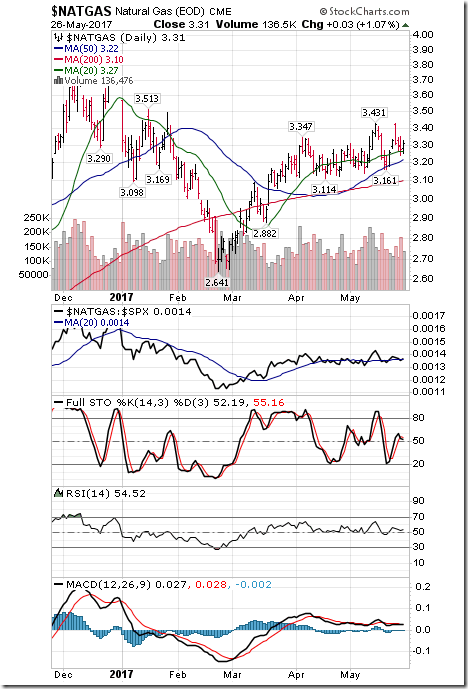
Natural Gas added $0.05 per MBtu (1.53%) last week. Intermediate trend remains up. Strength relative to the S&P 500 Index remains neutral. “Natty” remained above its 20 day moving average. Short term momentum indicators are trending up. Technical score increased last week to 4 from 2
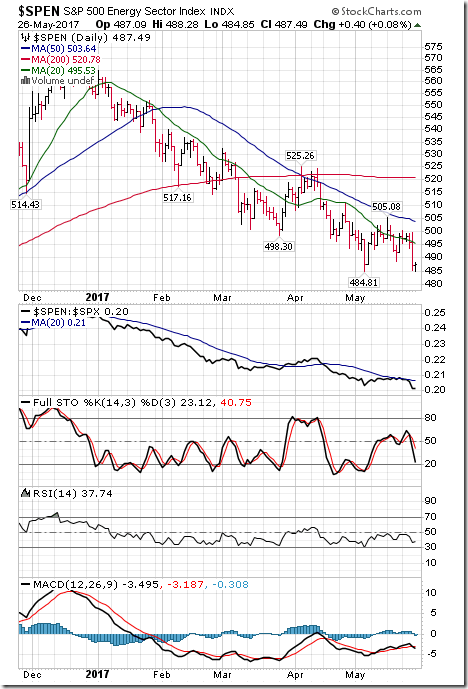
The S&P Energy Index dropped 10.66 points (2.14%) last week. Intermediate trend remains down. Strength relative to the S&P 500 Index changed to negative from neutral. The Index dropped below its 20 day moving average. Short term momentum indicators are trending down. Technical score dropped last week to -6 from 0.
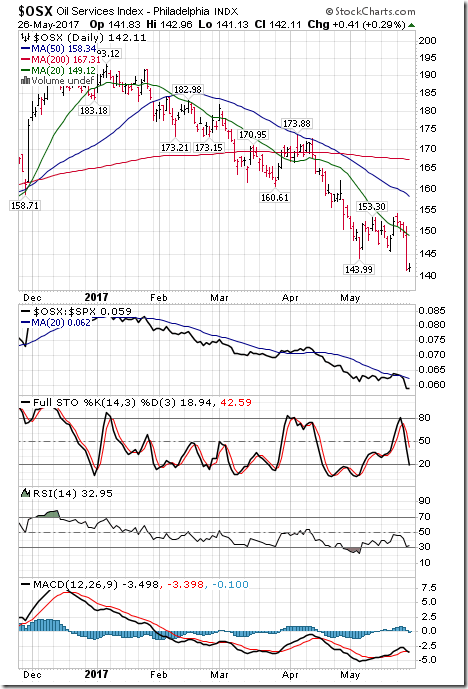
The Philadelphia Oil Services Index dropped another 10.34 points (6.78%) last week. Intermediate downtrend was confirmed on a move below 143.99. Strength relative to the S&P 500 Index changed to negative from neutral. The Index dropped below its 20 day moving average. Short term momentum indicators are trending down. Technical score dropped last week to -6 from 0.
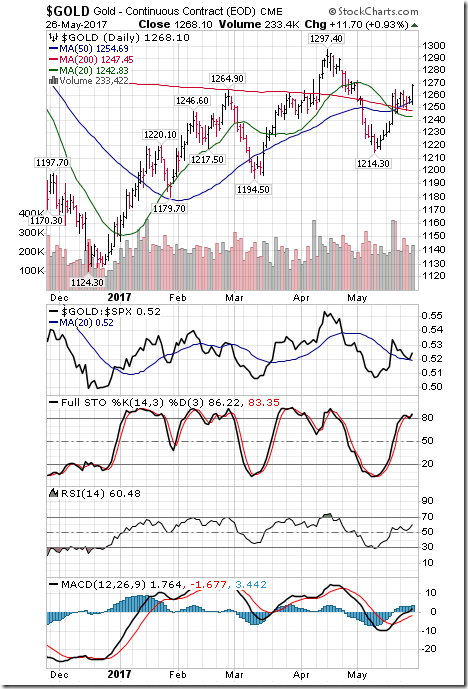
Gold gained $14.50 per ounce (1.16%) last week. Intermediate trend remains up. Strength relative to the S&P 500 Index remains positive. Gold remains above its 20 day moving average. Short term momentum indicators are trending up. Technical score remained last week at 6.
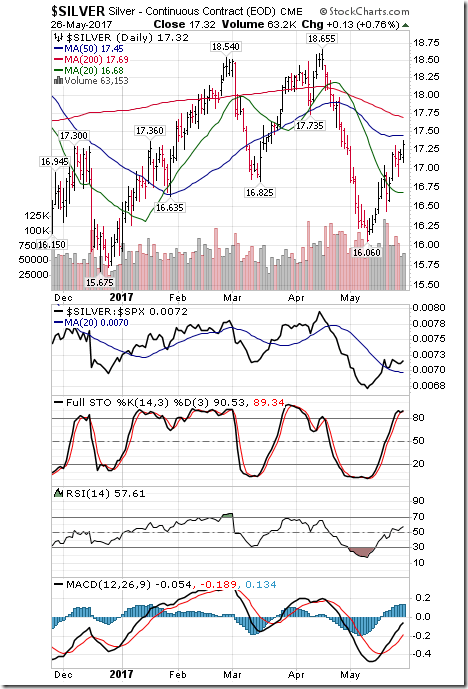
Silver gained $0.52 per ounce (3.10%) last week. Intermediate trend remains neutral. Strength relative to the S&P 500 Index turned positive from neutral. Silver moved above its 20 day moving average. Short term momentum indicators are trending up. Technical score increased last week to 4 from 0.
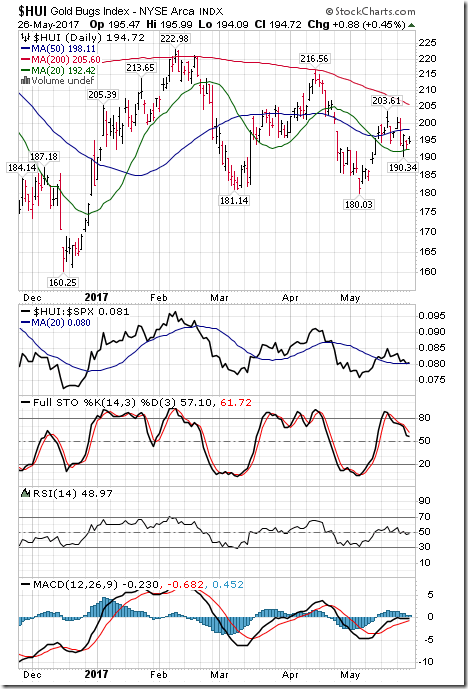
The AMEX Gold Bug Index slipped 2.39 points (1.22%) last week. Intermediate trend remains down. Strength relative to the S&P 500 Index changed to neutral from positive. The Index remains above its 20 day moving average. Short term momentum indicators are trending down. Technical score dropped last week to -2 from 2
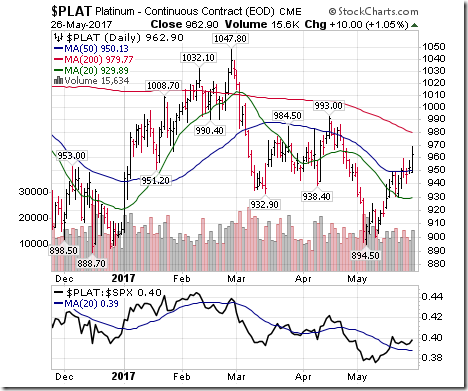
Platinum gained $22.70 per ounce (2.41%) last week. Trend remains down. Relative strength remains positive. Trades above its 20 day MA. Momentum is trending up. Score remains 2.
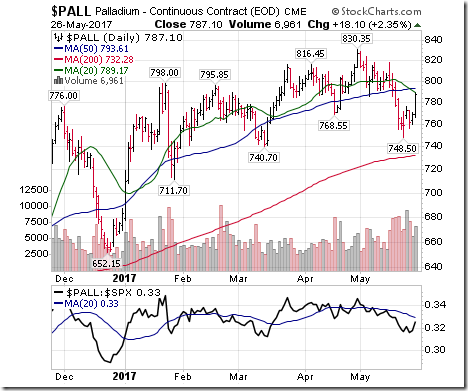
Palladium gained $26.40 per ounce (3.47%) last week. Intermediate trend remains neutral. Relative strength remains negative. PALL remains below its 20 day moving average.
Short term momentum indicators have turned up. Score improved to -2 from -4.
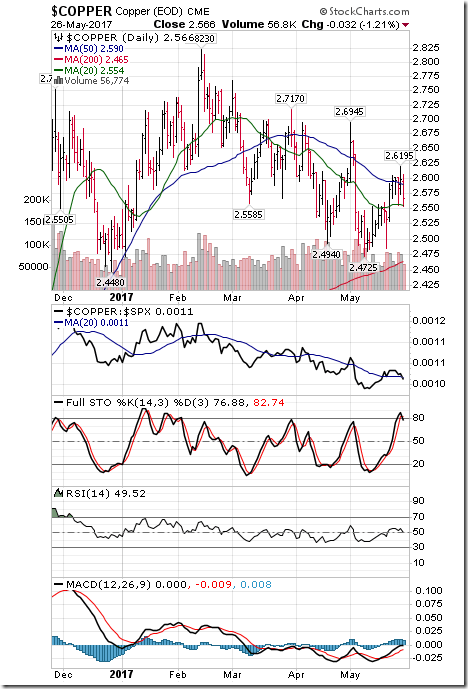
Copper slipped 0.014 cents per lb. (0.54%) last week. Intermediate trend remains down. Strength relative to the S&P 500 Index remains neutral. Copper remains above its 20 day moving average. Short term momentum indicators are trending up. Technical score remained last week at 0.
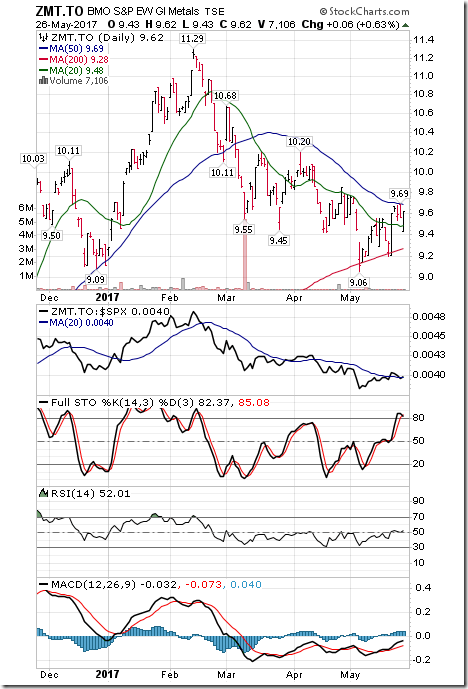
The BMO Base Metal ETF added 0.02 (0.21%) last week. Intermediate trend remains down. Strength relative to the S&P 500 Index remains neutral Units remained above their 20 day moving average. Short term momentum indicators are trending up. Technical score remained last week to 0.
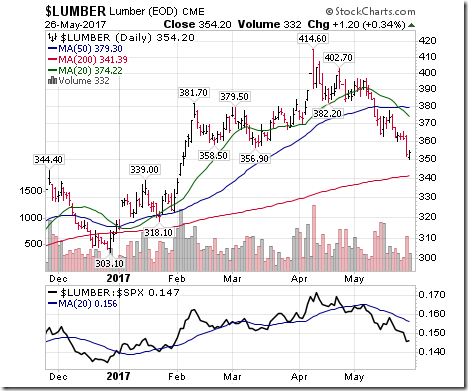
Lumber lost another $8.80 (2.42%) last week. Trend remains down. Relative strength remains negative. Trades below its 20 day MA. Momentum remains down. Score remains –6
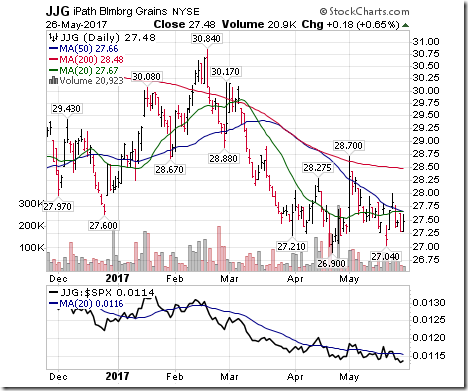
Grain ETN dropped $ 0.19 (0.69%) last week. Trend remains neutral. Relative strength changed to negative from neutral. Units moved below their 20 day moving average Short term momentum indicators are trending up. Technical score dropped last week to -2 from 0.
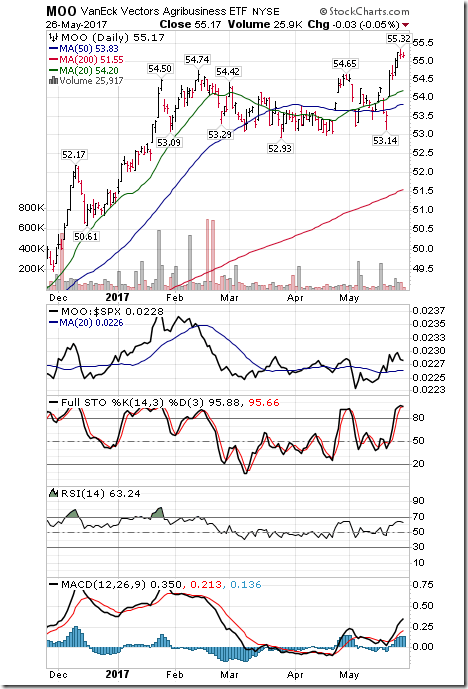
Agriculture ETF gained $0.55 (1.00%) last week. Intermediate trend changed to up from neutral on a move above $54.74. Strength relative to the S&P 500 Index remained positive. Units remained above their 20 day moving average. Short term momentum indicators are trending up. Technical score increased last week to 6 from 4.
Interest Rates
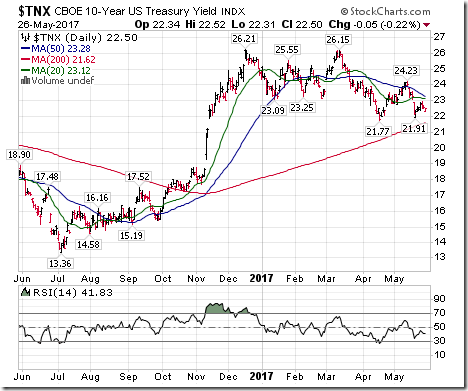
Yield on 10 year Treasuries gained 5 basis points (0.22%) last week. Intermediate trend remains down. Yield remains below its 20 day moving average.
Short term momentum indicators are trending down.
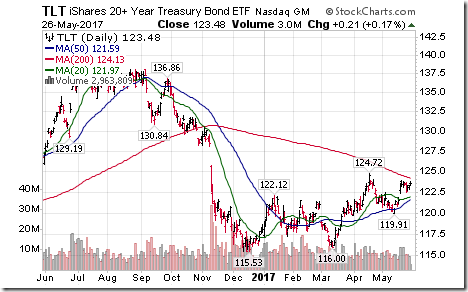
Price of the long term Treasury Bond ETF dipped $0.23 (0.19%) last week. Intermediate trend remains up. Units remained above their 20 day moving average.
Volatility
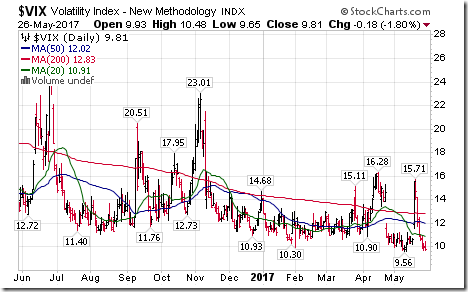
The VIX Index dropped another 2.23 (18.52%) last week. Intermediate trend remains down. The Index dropped back below its 20 day moving average.
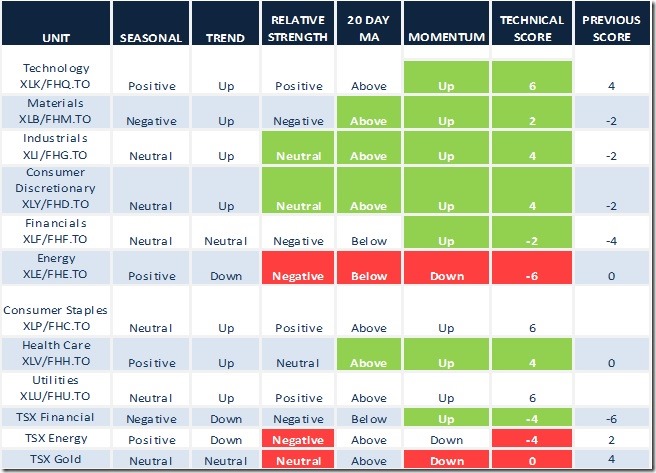
Sectors
Daily Seasonal/Technical Sector Trends for May 26th 2017
Green: Increase from previous day
Red: Decrease from previous day
WALL STREET RAW RADIO FOR MAY 27, 2017: HOST, MARK LEIBOVIT:
Here is the link:
CSTA Events
Toronto North York Chapter Meeting
6:30 PM EDT May 31st
Questrade Brokerage: 5700 Yonge St. Ground Floor 1
Oakville Chapter Meeting
7:00 PM EDT June 14th
Oakville Town Hall
Speaker: Sarah Potter from SheCanTrade.com
CSTA Annual Meeting
12:00 Noon EDT June 5th
Sheraton Hotel: 123 Queen Street West
Speaker: Larry Berman
Everyone is welcome. Please register at www.csta.org
Disclaimer: Seasonality and technical ratings offered in this report and www.equityclock.com are for information only. They should not be considered as advice to purchase or to sell mentioned securities. Data offered in this report is believed to be accurate, but is not guaranteed

