by Don Vialoux, Timingthemarket.ca
The Bottom Line
The natural time for start of a correction between June 15th and October 15 by most world equity markets is about to be reached at a time when equity markets are intermediate overbought and showing early momentum signs of rolling over. Exceptions exist (e.g. China and related equities)
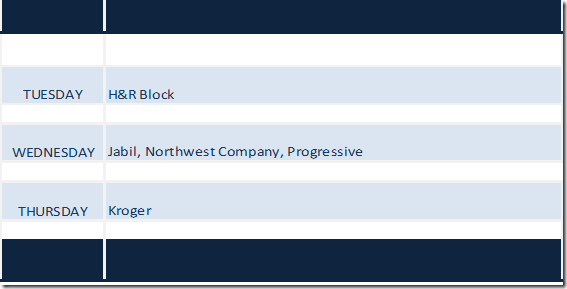
Earnings News This Week
Economic News This Week
May Producer Prices are to be released at 8:30 AM EDT on Tuesday. Excluding food and energy, May Producer Prices are expected to increase 0.1% versus a gain of 0.5% in April.
May Consumer Prices to be released at 8:30 AM EDT on Wednesday are expected to be unchanged versus a gain of 0.2% in April. Excluding food and energy, May Consumer Prices are expected to increase 0.2% versus an increase of 0.1% in April
May Retail Sales to be released at 8:30 AM EDT on Wednesday are expected to increase 0.1% versus a gain of 0.4% in April. Excluding auto sales, May Retail Sales are expected to increase 0.2% versus a gain of 0.3% in April.
April Business Inventories are to be released at 10:00 AM EDT on Wednesday are expected to drop 0.1% versus a gain of 0.2% in March.
FOMC meeting results to be released at 2:00 PM EDT on Wednesday are expected to see a 0.25% increase in the Fed Fund rate to 1.00%-1.25%.
Initial jobless claims are to be released at 8:30 AM EDT on Thursday are expected to dip to 242,000 from 245,000 last week
June Empire State Manufacturing Index is to be released at 8:30 AM EDT on Thursday is expected to increase to 5.0 from -1.0 in May.
June Philly Fed Index is to be released at 8:30 AM EDT on Thursday is expected to dip to 27.0 from 38.8 in May.
May Industrial Production to be released at 9:15 AM EDT on Thursday is expected to increase 0.2% versus a gain of 1.0% in April. May Capacity Utilization is expected to increase to 76.8% from 76.7% in April.
May Housing Starts to be released at 8:30 AM EDT on Friday are expected to increase to 1.22 million units from 1.172 million units in April.
June Michigan Sentiment Index is to be released at 10:00 AM EDT on Friday is expected to remain unchanged from May at 97.1.
Observations
Technical action by S&P 500 stocks was mixed last week: Thirty one stocks broke intermediate resistance and 21 stocks broke intermediate support. Notable on the list breaking intermediate resistance were Financials and Materials stocks. Notable on the list breaking intermediate support were Consumer Discretionary stocks. Number of stocks in an uptrend increased to 280 from 267, number of stocks in a neutral trend dropped to 47 from 51 and number of stocks in a downtrend dropped to 173 from 182. The Up/Down ratio increased last week to (280/173=) 1.62 from 1.47.
U.S. economic news this week is expected to be quietly bearish implying a slight slowdown relative to the previous month. Focus this week is on news following the FOMC meeting. Overwhelming consensus is that the Fed will increase the Fed Fund rate by 0.25%. Traders are watching closely for guidance on futures increases this year.
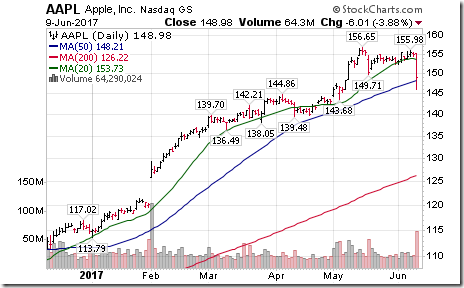
Technical action by S&P 500 stocks by short term technical indicators (momentum, above /below 20 day moving average) remained positive last week for most equity markets and sectors. Indicators generally are overbought, but have yet to show signs of rolling over. The exception was the Technology sector that recorded a significant drop in momentum on Friday. The trigger was a breakdown by Apple and its formation of a double top pattern.
Intermediate technical indicators (Percent trading above 50 day moving average, Bullish Percent Index generally moved higher last week to more overbought levels. Some have rolled over.
The outlook for S&P 500 companies remains promising. Earnings and sales estimates were virtually unchanged last week as the period of corporate silence prior to second quarter reports was entered. According to FactSet, second quarter earnings on a year-over-year basis are expected to increase 6.6% while sales are expected to increase 4.9%. Third quarter earnings are expected to increase 7.5% and sales are expected to 5.2%. Fourth quarter earnings are expected to increase 12.4% and sales are expected to 5.2%. For 2017, earnings are expected to increase 9.9% and sales are expected to increase 5.4%.
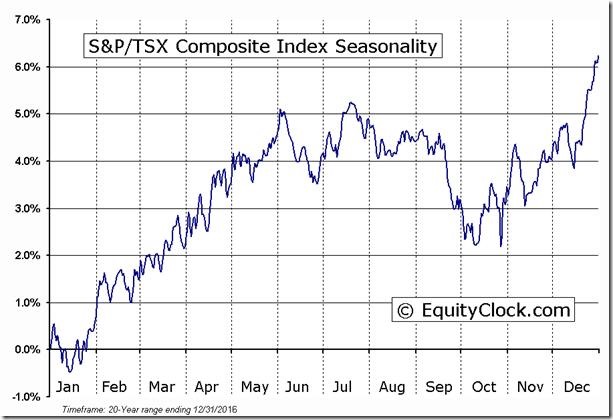
Seasonal Influences by North American equity markets tend to be mixed in the month of June. Long term returns since 1950 indicate an average return per period by the TSX Composite and S&P 500 Index near zero. On average during the past 20 periods, the TSX Composite Index has reached a seasonal peak on or about June 9th and a second peak in mid-July. Frequently, the S&P 500 Index has reached a peak near June 15th with a second peak in mid-July. Momentum spikes frequently occur in the June /mid-October period. Spike by the VIX Index four weeks ago proved to be a false alarm. However, short term overbought conditions and unsettling political conditions continue to suggest watchful waiting. If an upside surprise occurs in North American equity indices, it likely will happen late in June/early July coinciding with the seasonal Independence Day trade.
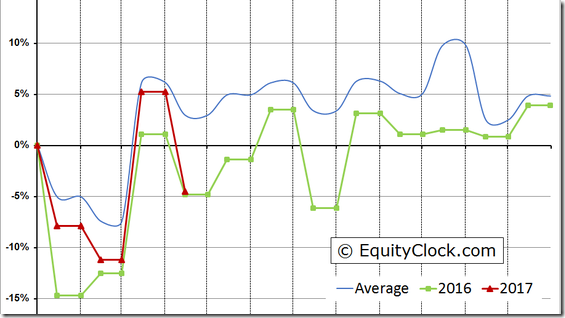
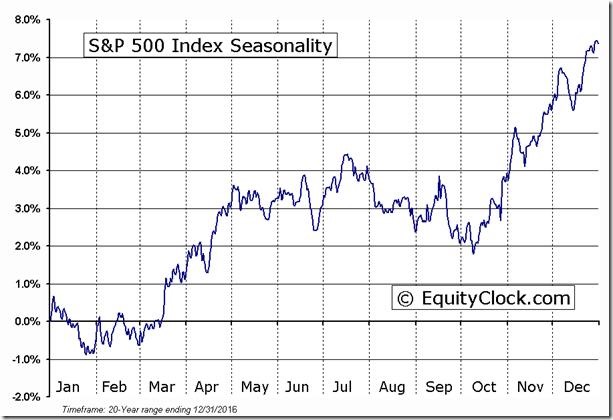
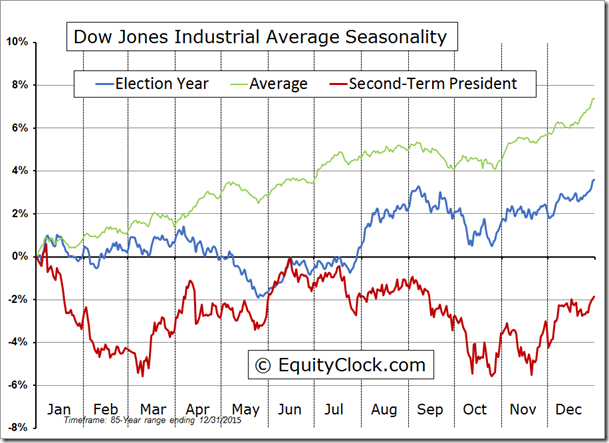
U.S. equity markets have a history of moving lower from mid-June to mid-October in Presidential cycle years after a two term President has been replaced (as indicated this year). See red line in the chart below.
Friday is Quadruple Witching Day. Expect higher than average volume and higher volatility.
Ratings on Equity Indices and Related ETFs
Daily Seasonal/Technical Equity Trends for June 9th 2017
Green: Increase from previous day
Red: Decrease from previous day
Calculating Technical Scores
Technical scores are calculated as follows:
Intermediate Uptrend based on at least 20 trading days: Score 2
Higher highs and higher lows
Intermediate Neutral trend: Score 0
Not up or down
Intermediate Downtrend: Score -2
Lower highs and lower lows
Outperformance relative to the S&P 500 Index: Score: 2
Neutral Performance relative to the S&P 500 Index: 0
Underperformance relative to the S&P 500 Index: Score –2
Above 20 day moving average: Score 1
At 20 day moving average: Score: 0
Below 20 day moving average: –1
Up trending momentum indicators (Daily Stochastics, RSI and MACD): 1
Mixed momentum indicators: 0
Down trending momentum indicators: –1
Technical scores range from -6 to +6. Technical buy signals based on the above guidelines start when a security advances to at least 0.0, but preferably 2.0 or higher. Technical sell/short signals start when a security descends to 0, but preferably -2.0 or lower.
Long positions require maintaining a technical score of -2.0 or higher. Conversely, a short position requires maintaining a technical score of +2.0 or lower.
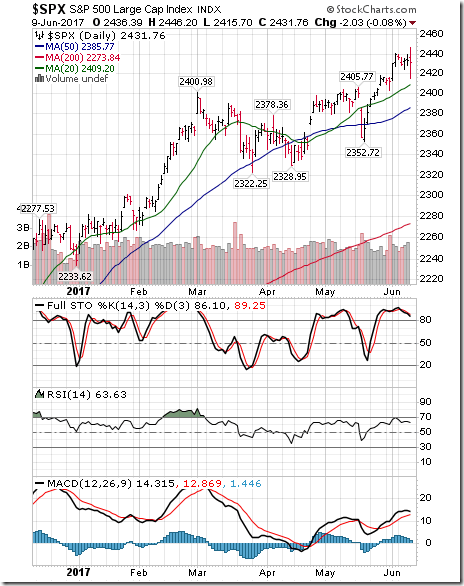
The S&P 500 Index slipped 7.31 points (0.30%) last week. Intermediate trend remains up. The Index remains above its 20 moving average. Short term momentum indicators began to trend down on Friday.
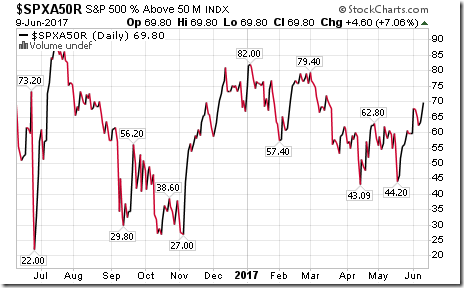
Percent of S&P 500 stocks trading above their 50 day moving average (also known as the S&P 500 Momentum barometer) increased last week to 69.80 from 67.40. Percent remains intermediate overbought.
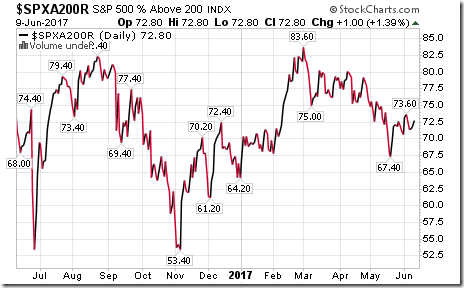
Percent of S&P 500 stocks trading above their 200 day moving average slipped last week to 72.80 from 73.60. Percent remains intermediate overbought.
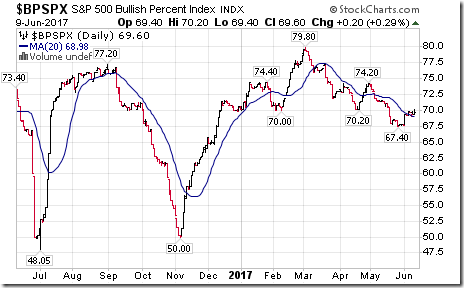
Bullish Percent Index for S&P 500 stocks increased last week to 69.60 from 69.20 and moved above its 20 day moving average. The Index remains intermediate overbought and trending down.
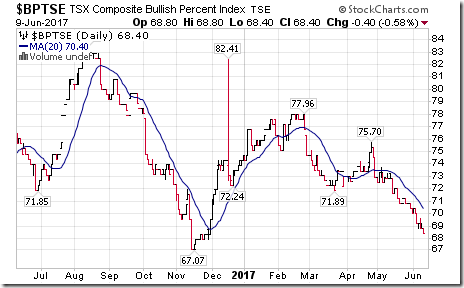
Bullish Percent Index for TSX stocks dropped last week to 68.40 from 70.00. The Index remains intermediate overbought and trending down.
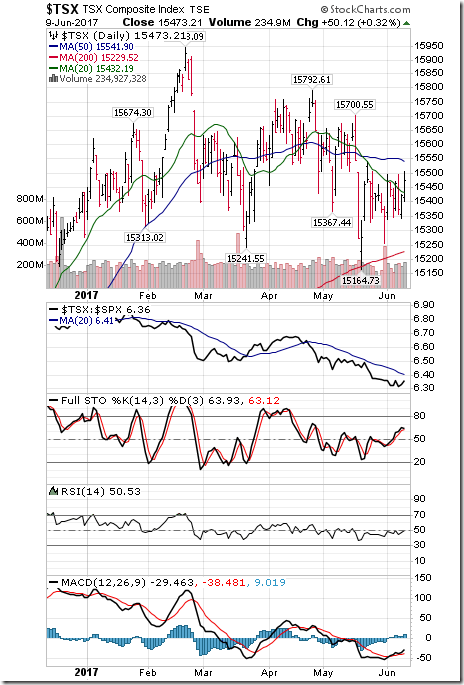
The TSX Composite Index added 30.46 points (0.20%) last week. Intermediate trend remains down (Score: -2. Strength relative to the S&P 500 Index remains negative (Score: -2). The Index moved above its 20 day moving average on Friday (Score: 1). Short term momentum indicators are trending up (Score: 1). Technical score increased last week to -2 from -6.
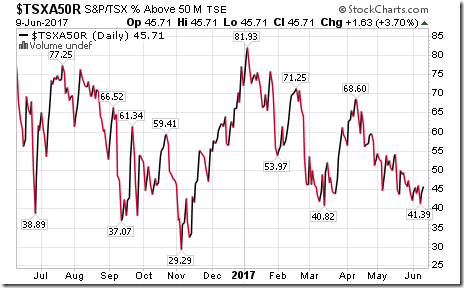
Percent of TSX stocks trading above their 50 day moving average (Also known as the TSX Momentum Barometer) increased last week to 45.71 from 45.53. Percent remains intermediate neutral and trending down.
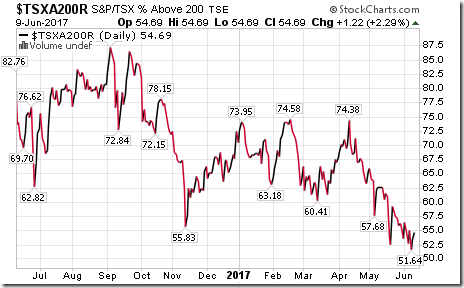
Percent of TSX stocks trading above their 200 day moving average slipped last week to 54.69 from 54.88. Percent remains intermediate overbought and trending down.
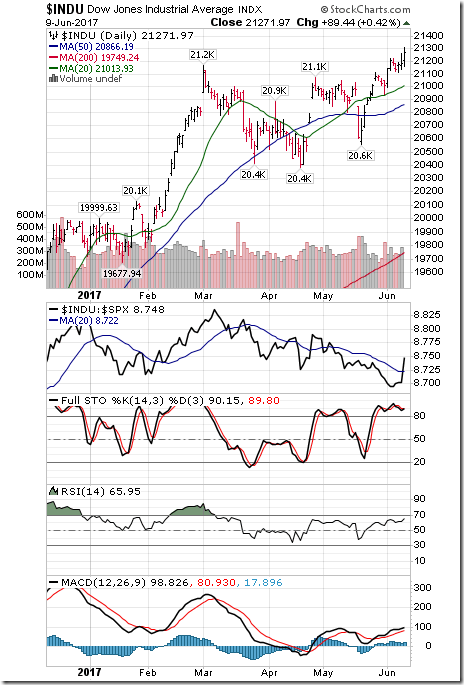
Dow Jones Industrial Average gained 65.68 points (0.31%) last week to close at an all-time high. Intermediate trend remains up. Strength relative to the S&P 500 Index changed to positive from negative on Friday. The Average remains above its 20 day moving average. Short term momentum indicators are trending up. Technical score increased last week to 6 from 2.
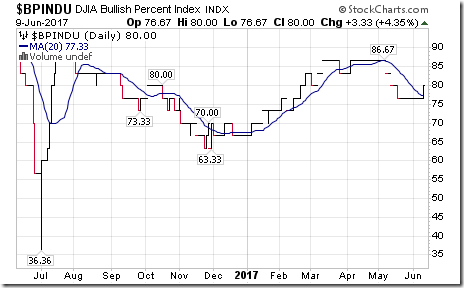
Bullish Percent Index for Dow Jones Industrial stocks increased last week to 80.00 from 76.67 and moved above its 20 day moving average. The Index remains intermediate overbought.
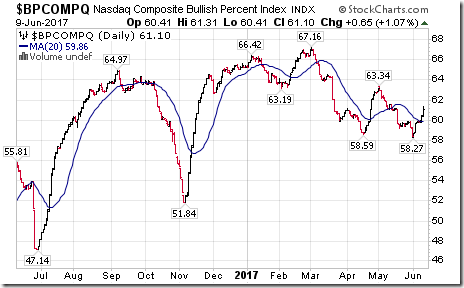
Bullish Percent Index for NASDAQ Composite stocks increased last week to 61.10 from 59.69 and moved above its 20 day moving average. The Index remains intermediate overbought.
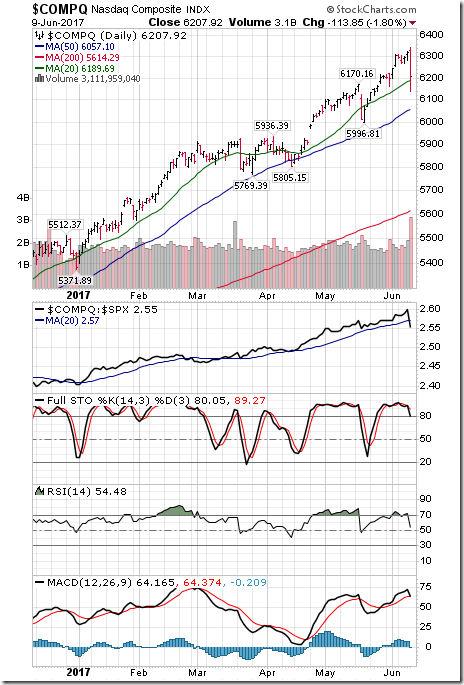
The NASDAQ Composite Index dropped 97.88 points (1.55%) last week with the entire drop occurring in the second half of trading on Friday. Intermediate trend remains up. Strength relative to the S&P 500 Index changed on Friday to Neutral from Positive. The Index remained above its 20 day moving average. Short term momentum indicators rolled over on Friday. Technical score dropped last week to 2 from 6.
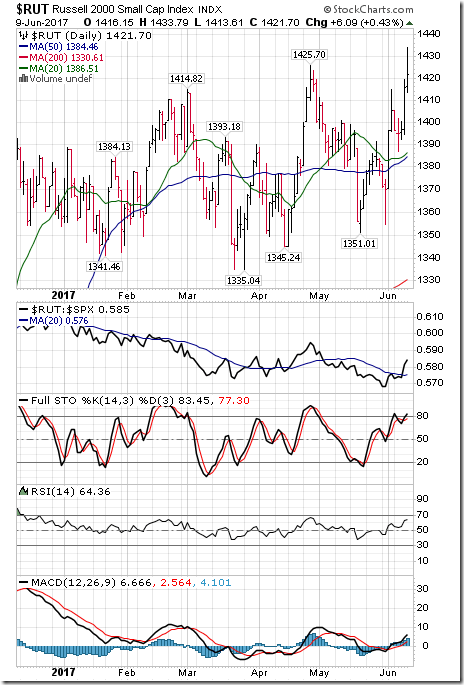
The Russell 2000 Index gained 16.31 points (1.16%) last week. Intermediate uptrend was confirmed on Friday on a move above 1,425.70. Strength relative to the S&P 500 Index changed to Positive from Neutral. The Index remains above its 20 day moving average. Short term momentum indicators are trending up. Technical score increased last week to 6 from 4.
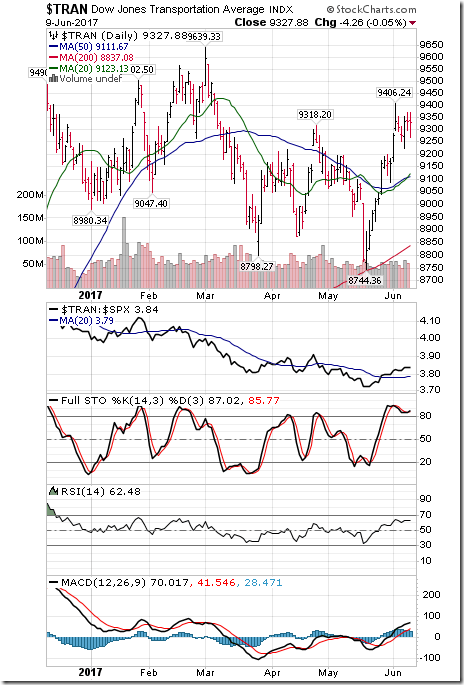
Dow Jones Transportation Average slipped 3.84 points (0.04%) last week. Intermediate trend remained Neutral. Strength relative to the S&P 500 Index remained Positive. The Average remained above its 20 day moving average. Short term momentum indicators are trending up. Technical score remained last week at 4.
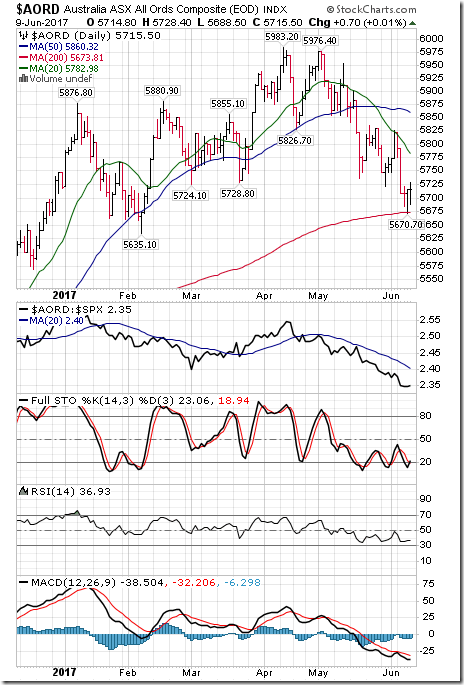
The Australia All Ordinaries Composite Index dropped 105.60 points (1.81%) last week. Intermediate trend remains down. Strength relative to the S&P 500 Index remains Negative. The Index remains below its 20 day moving average. Short term momentum indicators are trending down. Technical score slipped last week to -6 from -4.
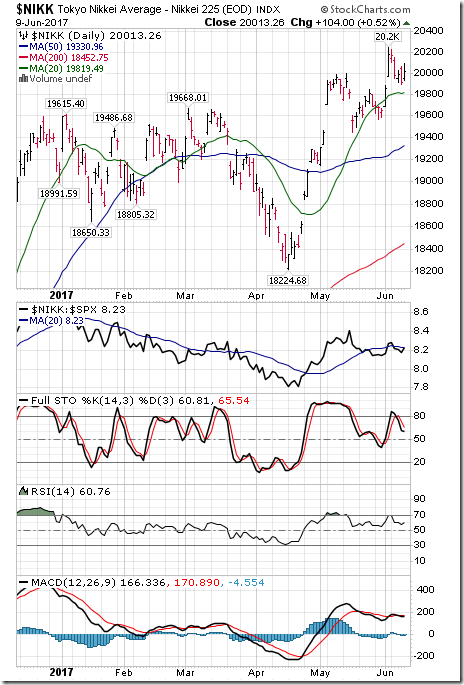
The Nikkei Average dropped 164.02 points (0.81%) last week. Intermediate trend remains up. Strength relative to the S&P 500 Index remained Neutral. The Average remained above its 20 day moving average. Short term momentum indicators are trending up. Technical score remained last week at 4
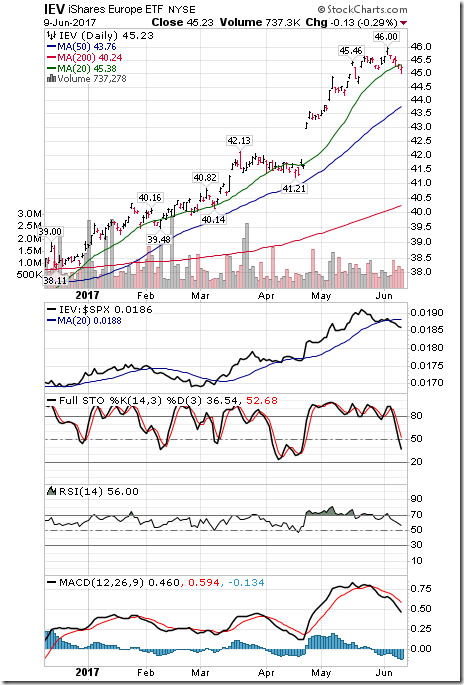
Europe iShares dropped $0.75 (1.63%) last week. Intermediate trend remains up. Strength relative to the S&P 500 Index changed to Negative from Positive. Units dropped below their 20 day moving average on Friday. Short term momentum indicators have rolled over. Technical score dropped last week to -2 from 4.
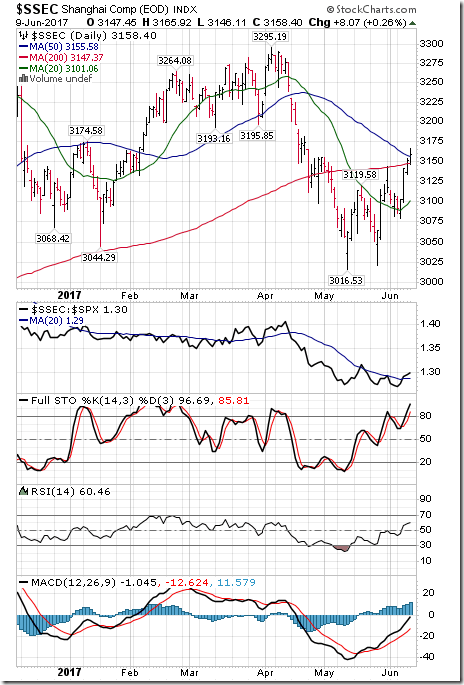
The Shanghai Composite Index gained 52.86 points (1.70%) last week. Intermediate trend remains down. Strength relative to the S&P 500 Index changed to Positive from Neutral. The Index remained above its 20 day moving average. Short term momentum indicators are trending up. Technical score increased last week to 2 from 0.
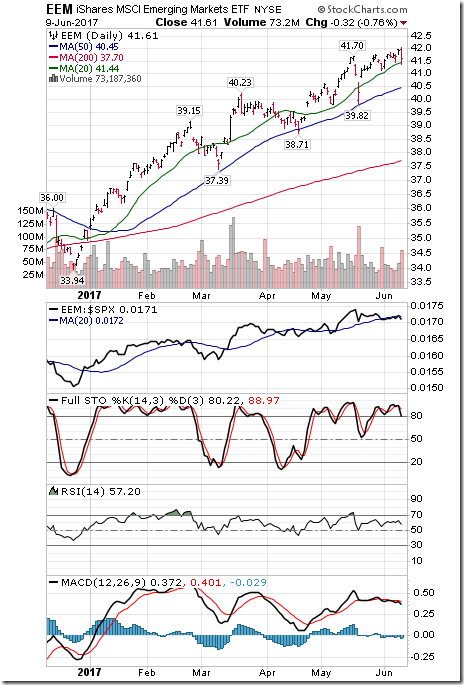
Emerging Markets iShares slipped $0.15 (0.36%) last week. Intermediate trend remains up. Strength relative to the S&P 500 Index changed to Neutral from Positive. Units remained above their 20 day moving average. Short term momentum indicators have turned down. Technical scored dropped last week to 2 from 6.
Currencies
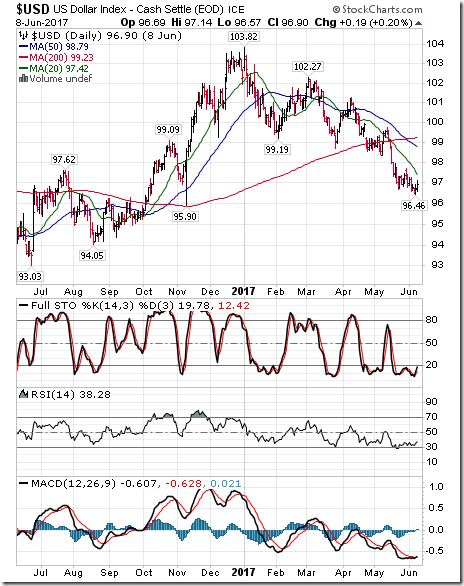
The U.S. Dollar Index added 0.23 (0.24%) last week. Intermediate trend remains down. The Index remains below its 20 day moving average. Short term momentum indicators are trending down, but are oversold and showing early signs of bottoming.
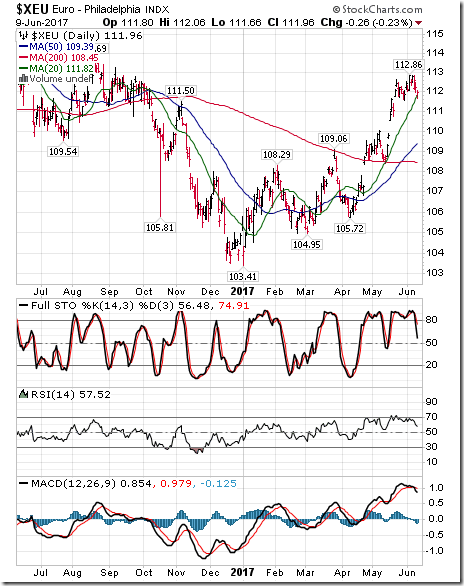
The Euro dropped 0.87 (0.77%) last week. Intermediate trend remains up. The Euro remains above its 20 day moving average. Short term momentum indicators have rolled over.
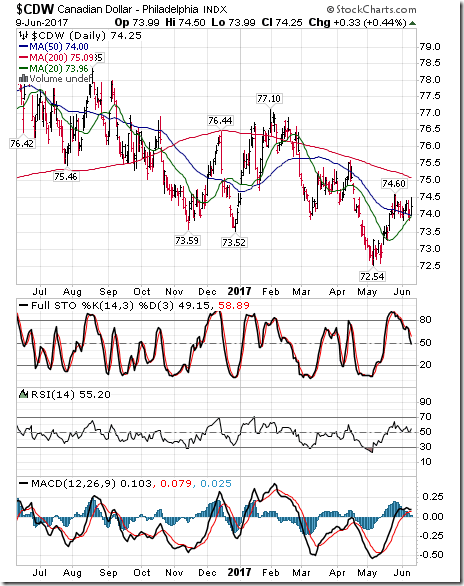
The Canadian Dollar added US 0.09 cents (0.15%) last week. Intermediate trend remains down. The Canuck Buck remains above its 20 day moving average. Short term momentum indicators are trending down.
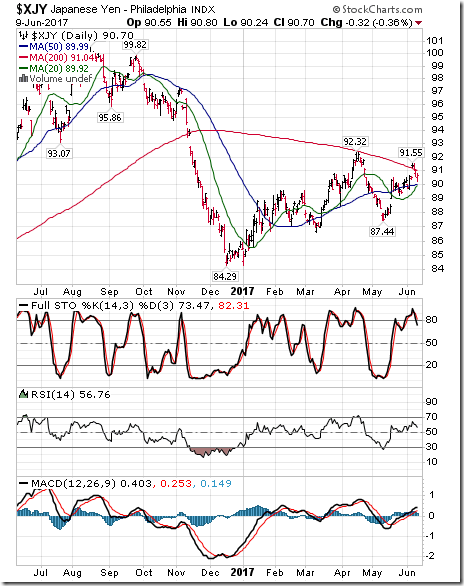
The Japanese Yen added 0.12 (0.13%) last week. Intermediate trend remains up. The Yen remains above its 20 day moving average. Short term momentum indicators are rolling over.
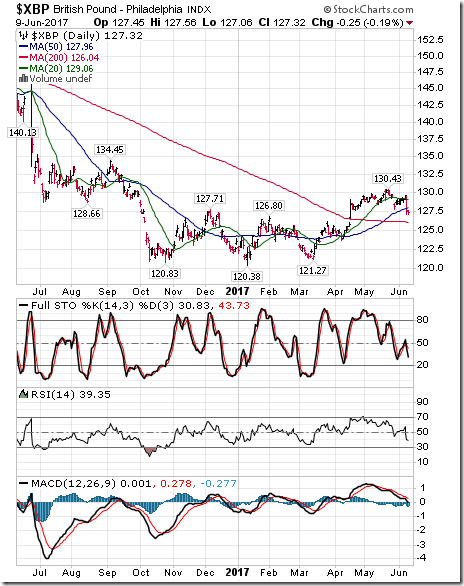
The British Pound dropped 1.63 (1.26%) last week. Intermediate trend remains up. The Pound remained below its 20 day moving average. Short term momentum indicators are trending down.
Commodities and Related ETFs
Daily Seasonal/Technical Commodities Trends for June 9th 2017
Green: Increase from previous day
Red: Decrease from previous day
* Excludes adjustment from rollover of futures contracts
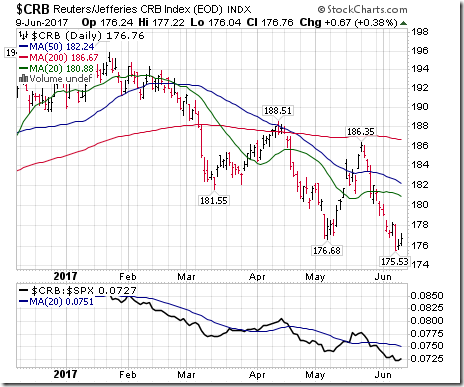
The CRB Index dropped 1.20 points (1.26%) last week. Intermediate trend remains down. Strength relative to the S&P 500 Index remains Negative. The Index remains below its 20 day moving average. Short term momentum indicators are trending down.
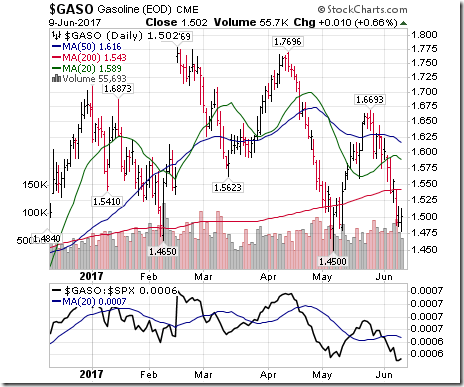
Gasoline dropped $0.15 per gallon (4.76%) last week. Intermediate trend remains down. Strength relative to the S&P 500 Index remained Negative. Gas remains below its 20 day moving average. Short term momentum indicators are trending down. Technical score remained at -6.
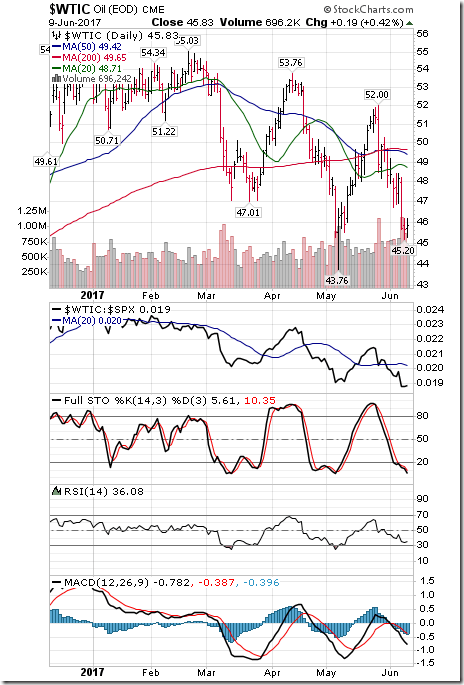
Crude Oil dropped $1.83 per barrel (3.84%) last week. Intermediate trend remains down. Strength relative to the S&P 500 Index remains Negative. Crude remains below its 20 day moving average. Short term momentum indicators are trending down. Technical score remained last week at -6.
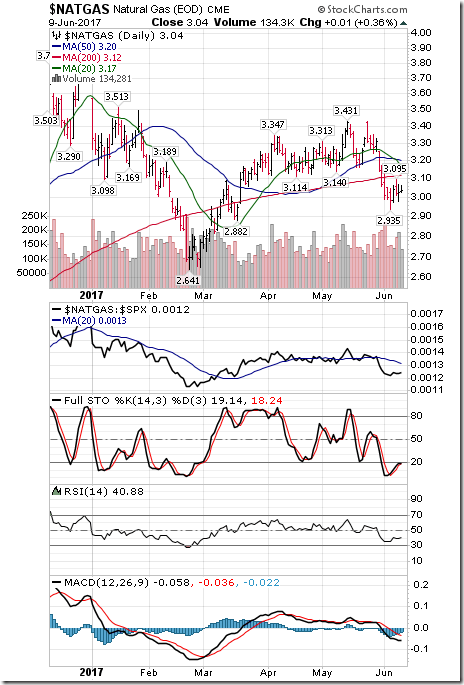
Natural Gas added $0.04 (1.33%) last week. Intermediate trend remains neutral. Strength relative to the S&P 500 Index remains Negative. “Natty” remains below its 20 day moving average. Short term momentum indicators are trending down. Technical score remained last week at -4.
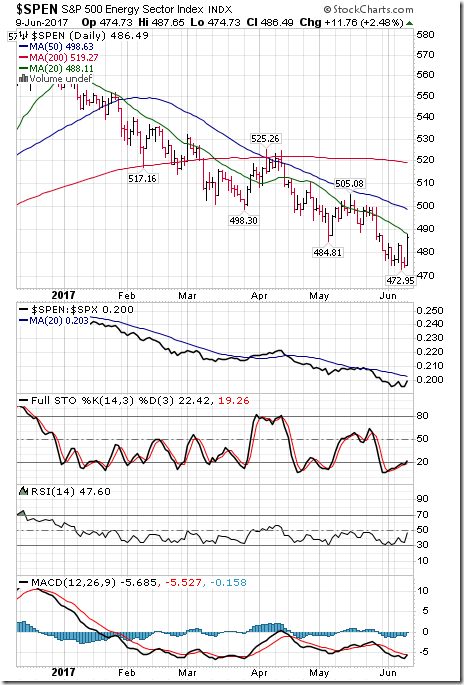
The S&P Energy Index added 9.82 points (2.06%) last week with the entire gain recorded on Friday. Intermediate trend remains down. Strength relative to the S&P 500 Index remained Negative. The Index remained below its 20 day moving average. Short term momentum indicators have just turned up. Technical score improved last week to -4 from -6.
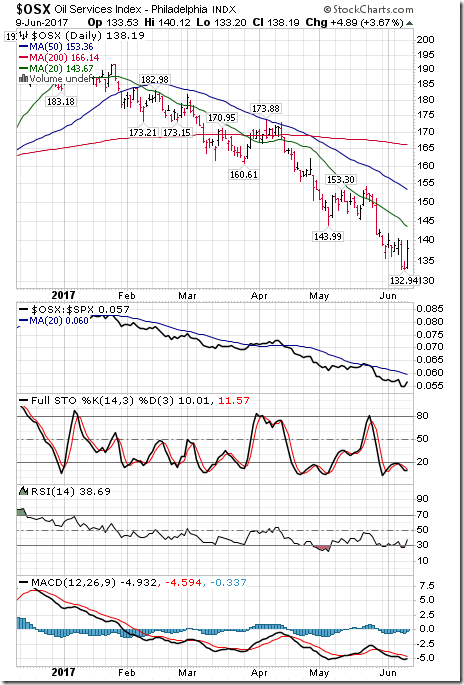
The Philadelphia Oil Services Index slipped 0.16 points (0.12%) last week. Intermediate trend remained down. Strength relative to the S&P 500 Index remains Negative. The Index remains below its 20 day moving average. Short term momentum indicators have just turned up. Technical score increased last week to -4 from -6.
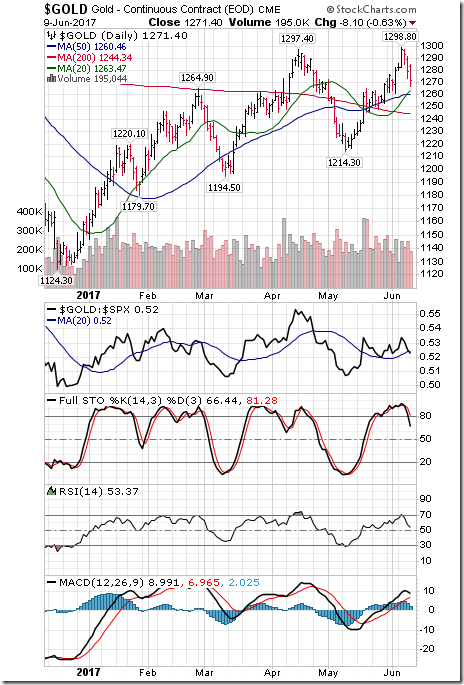
Gold dropped $8.70 per ounce (0.68%) last week. Intermediate uptrend was confirmed on a move above $1297.40. Strength relative to the S&P 500 Index changed to Neutral from Positive. Gold remained above its 20 day moving average. Short term momentum indicators have turned down. Technical score dropped last week to 2 from 6.
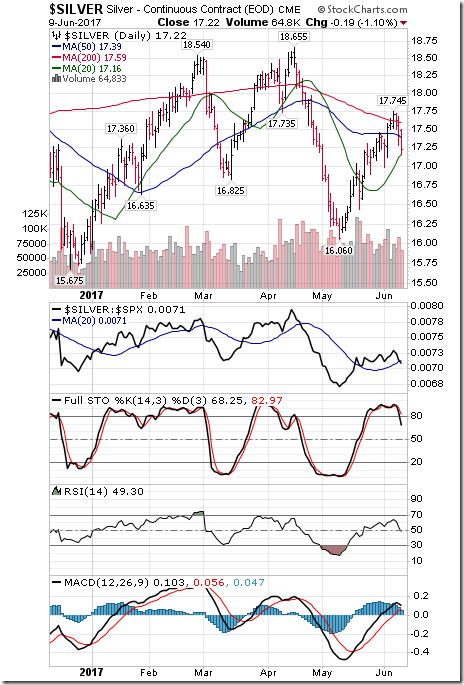
Silver dropped $0.30 per ounce (1.71%) last week. Intermediate trend remains neutral. Strength relative to the S&P 500 Index remains Positive. Silver remains below its 20 day moving average. Short term momentum indicators have rolled over. Technical score dropped last week to 2 from 4.
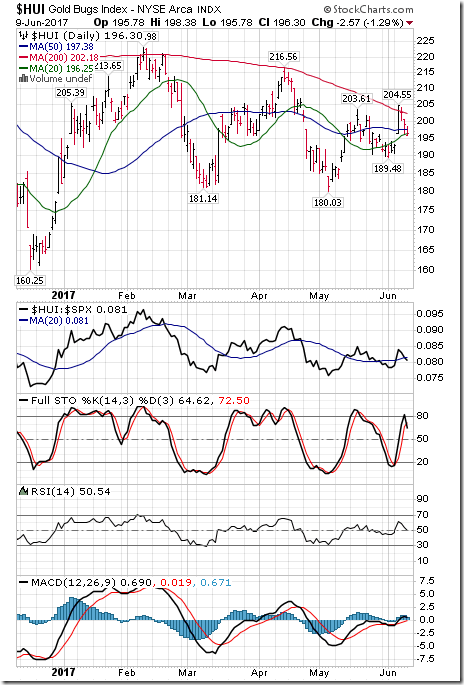
The AMEX Gold Bug Index gained 4.79 points (2.50%) last week. Intermediate trend remains down. Strength relative to the S&P 500 Index remains Neutral. The Index moved above its 20 day moving average. Short term momentum indicators have just rolled over. Technical score last week increased to -2 from -4.
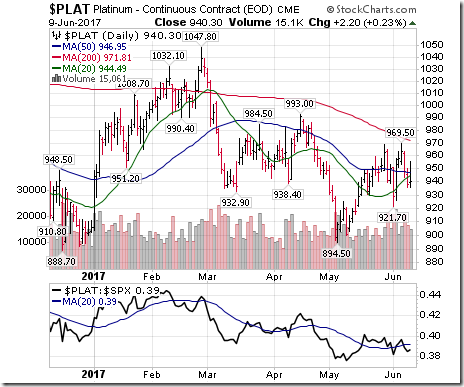
Platinum dropped $13.10 per ounce (1.37%) last week. Trend remains down. Relative strength remains Neutral. PLAT remains below its 20 day MA. Momentum trending down.
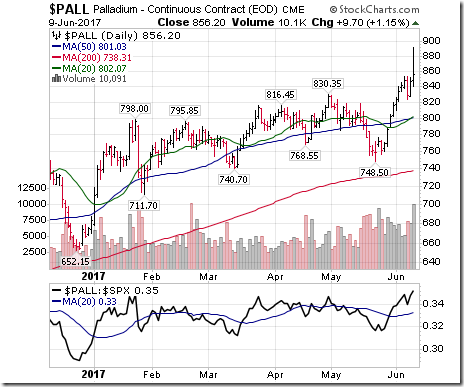
Palladium gained $22.15 per ounce (2.66%) last week. Intermediate trend remains up. Strength relative to the S&P 500 Index remained Positive. PALL remains above its 20 day moving average. Short term momentum indicators are trending up. Technical score remains at 6.
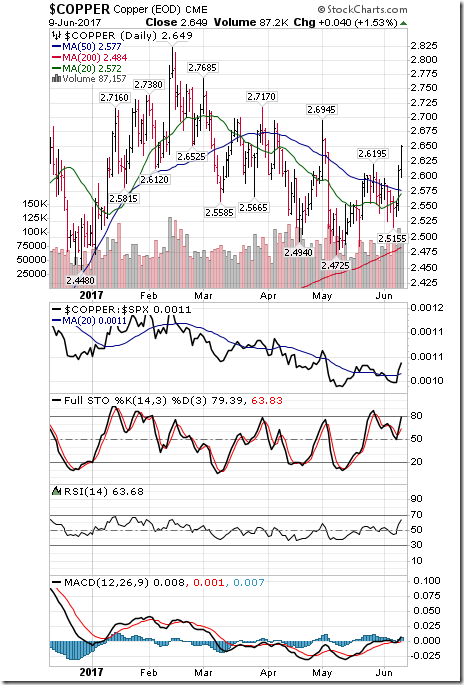
Copper gained 7.4 cents per lb (2.87%) last week. Intermediate trend remains down. Strength relative to the S&P 500 Index changed to Positive. Copper moved above its 20 day moving average. Short term momentum indicators are trending up. Technical score increased last week to 2 from -2.
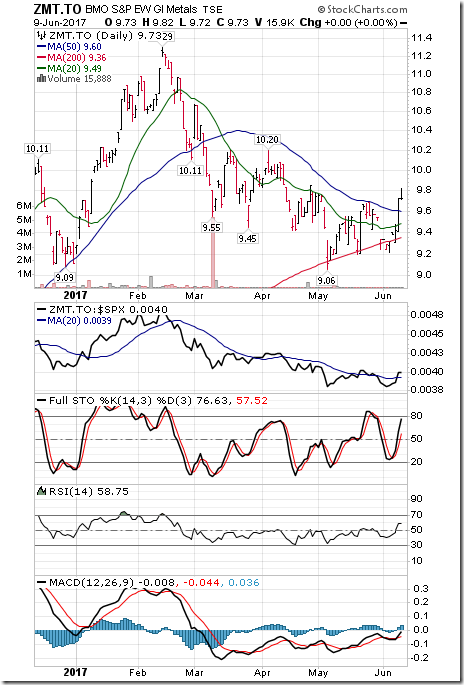
BMO Base Metals ETF gained $0.44 (4.69%) last week. Intermediate trend changed to Up from Down on a move above $9.69. Strength relative to the S&P 500 Index changed to Neutral from Negative. Units moved above their 20 day moving average. Short term momentum indicators are trending up. Technical score increased last week to 4 from -6.
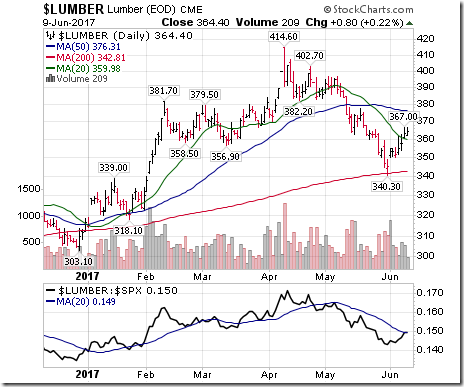
Lumber gained $10.80 (3.05%) last week. Intermediate trend remains down. Relative strength remains Negative. Moved above its 20 day MA. Momentum turned up.
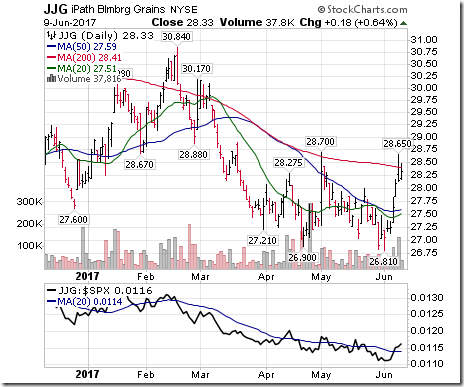
The Grain ETN gained $1.11 (4.08%) last week. Intermediate trend remains down. Strength relative to the S&P 500 Index remains Positive. Units moved above their 20 day moving average. Short term momentum indicators are trending up. Technical score increased to 2.
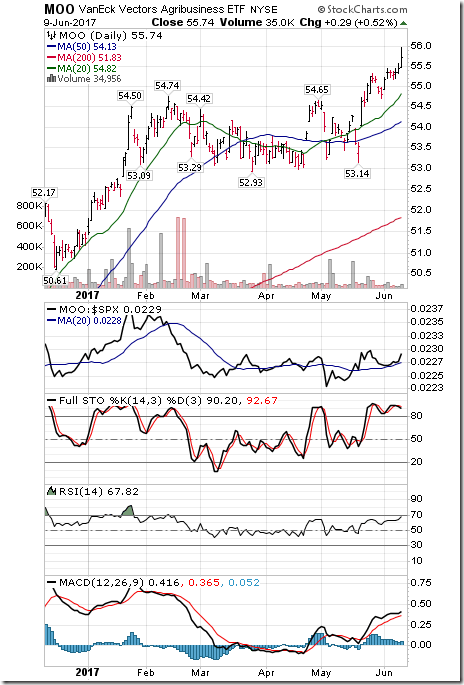
The Agriculture ETF gained $0.39 (0.78%) last week. Intermediate trend remains up. Strength relative to the S&P 500 Index remained Positive. Units remained above their 20 day moving average. Short term momentum indicators are trending up. Technical score remained last week at 6.
Interest Rates
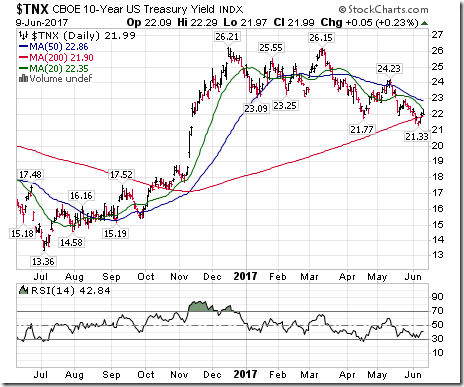
Yield on 10 Year Treasuries increased 4 basis points (1.85%) last week. Intermediate trend remains down. Yield remains below its 20 day moving average. Short term momentum indicators have turned up.
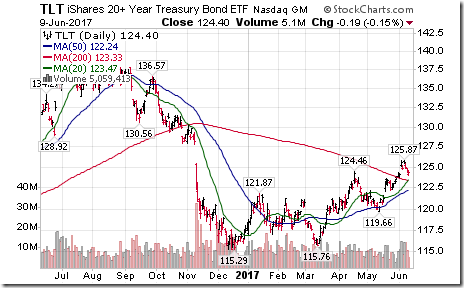
Conversely, price of the long term Treasury Bond slipped $1.22 (0.98%) last week. Intermediate trend remains up. Units remain above their 20 day moving average.
Volatility
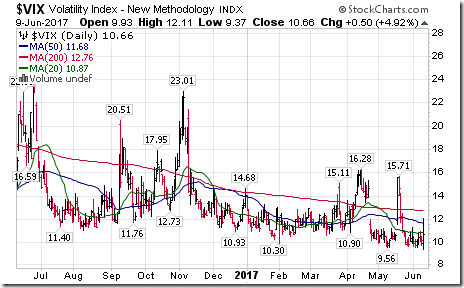
The VIX Index added 0.61 (9.33%) last week after briefly touching a 24 year low on Friday. The Index moved above its 20 day moving average on Friday.
Sectors
Daily Seasonal/Technical Sector Trends for June 9th 2017
Green: Increase from previous day
Red: Decrease from previous day
StockTwits Released on Friday
Natural gas at risk of completing a Head & Shoulders top coming into period of seasonal weakness. See http://www.equityclock.com/2017/06/08/stock-market-outlook-for-june-9-2017/
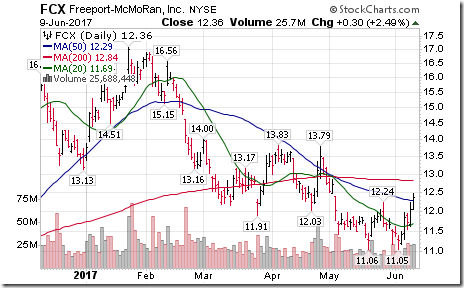
Technical action by S&P 500 stocks to 10:00: Quietly bullish. Breakouts: $FCX $MYL. No breakdowns.
Editor’s note: After 10:00 AM EDT, breakouts included FITB, SCHW, USB, DD, EMN, AFL, MTB, JEC, EMR, BRK.B, IBM, LYB,TROW, UA. Breakdowns included AAPL, DXC and CTXS
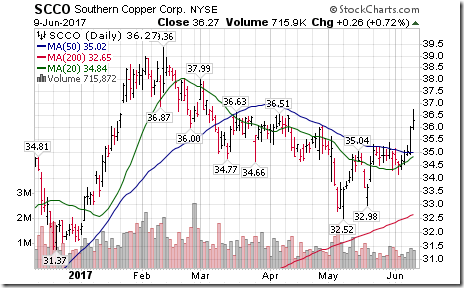
Southern Copper $SCCO, world’s largest copper producer moved above $36.51 extending an intermediate uptrend.
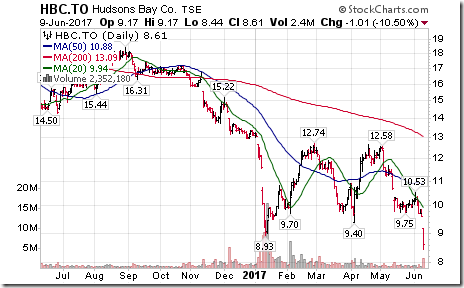
Hudson’s Bay Company $HBC.CA moved below $9.40 and $8.93 extending an intermediate uptrend.
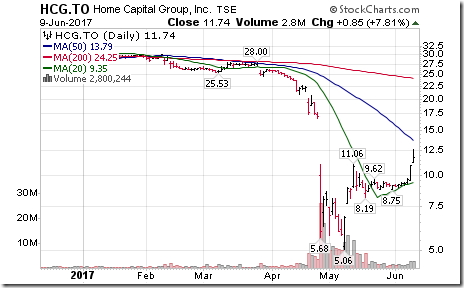
Home Capital Group $HCG.CA moved above $11.06 establishing an intermediate uptrend.
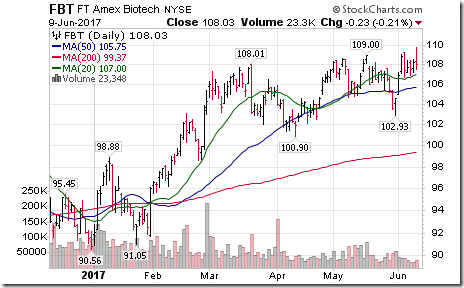
FT Biotech ETF $FBT moved above $109.00 to an 18 month high extending an intermediate uptrend. ‘Tis the season!
Wholesale sales down 9.3% in April, over 3 times the historical average decline.
Fertilizer stocks higher on rumored Uraikali/Belarus talks. Double bottom patterns by $AGU.CA $POT.CA $MOS also strong.
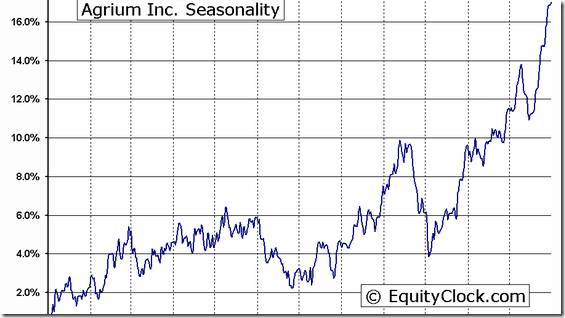
Seasonal influences positive for $POT and $AGU from late June to early September.
Apple $AAPL, a Dow Jones Industrial stock completed a double top pattern on a move below $149.71
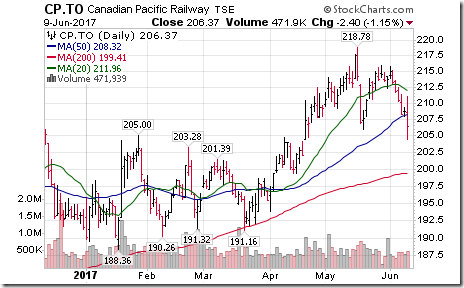
Cdn. Pacific $CP.CA, a TSX 60 stock moved below $205.90 completing a double top pattern.
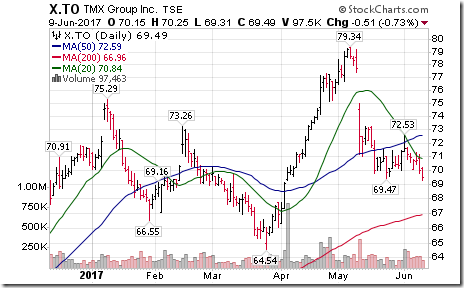
TMX Group $X.CA moved below $69.47 developing an intermediate downtrend.
Accountability Report
Loblaw (L.TO $76.01) originally was supported as a seasonal trade with StockTwits and Tech Talk comments on April 24th at $73.68. Its period of seasonal strength ends in mid-June. Technical parameters have deteriorated recently: Although trend remains up, strength relative to the S&P 500 Index and TSX Composite Index has turned Negative, short term momentum indicators have rolled over from overbought levels and the stock dropped below its 20 day moving average on Friday. Accordingly, the stock no longer is supported as a seasonal trade.
Metro (MRU.TO $44.38) originally was supported as a seasonal trade with StockTwits and Tech Talk comments at $40.28 on March 14th. Although seasonal influences remain positive until mid-July, technical weakness suggests truncating the trade. On Friday, the stock broke support at $44.74 to establish an intermediate downtrend. Strength relative to the S&P 500 Index and TSX Composite has turned negative. The stock recently dropped below its 20 day moving average. Its short term momentum indicators are trending down. Accordingly, the stock no longer is supported as a seasonal trade.
Software iShares (IGV $136.28) originally were supported as a seasonal trade with StockTwits and Tech Talk comments at $127.36 on April 19th. Although seasonal influences remain positive until mid-July, technical weakness suggests truncating the traded. On Friday, the stock started to underperform the S&P 500 Index, its momentum indicators turned negative and the stock broke below its 20 day moving average. Accordingly, the stock no longer is supported as a seasonal trade.
WALL STREET RAW RADIO – JUNE 10, 2017 - WITH HOST, MARK LEIBOVIT – STARRING DON VIALOUX, HENRY WEINGARTEN, HARRY BOXER, SINCLAIR NOE, CRAIG SMITH AND CHRIS KIMBLE. http://tinyurl.com/y8hfwqch
Here is a summary of Don Vialoux’s comments:
Equities in China have come alive during the past four weeks. Strength is related to record export data reported last week. China large cap iShares (FXI) were up 8.2% during the period.
Strength in China is pouring into related North American equities, most notably into metals and mining stocks. Notably stronger with short term breakouts on Thursday included iShares Metals and Mining ETF (XME) in the U.S. and BMO Base Metal ETF (ZMT) in Canada.
The sector is lining up for an interesting seasonal trade. Seasonal influences for Metals and Mining stocks are positive from early June to the end of July.
June 14th could be an important date for U.S. equity markets:
· The Federal Reserve is expected to increase its Fed Fund rate by 0.25% to 1.00%-1.25%. Watch for guidance on future increases
· On average during the past 20 years, U.S. equity markets have reached a seasonal peak either on June 15th or July 15th
· June 14th is President Trump’s birthday. According to Henry Weingarten, his birthday could have astrologic significance that could influence equity markets
Disclaimer: Seasonality and technical ratings offered in this report and www.equityclock.com are for information only. They should not be considered as advice to purchase or to sell mentioned securities. Data offered in this report is believed to be accurate, but is not guaranteed
Copyright © DV Tech Talk, Timingthemarket.ca

![clip_image002[6] clip_image002[6]](http://advisoranalyst.com/glablog/wp-content/uploads/HLIC/60095b05fce54aec90a1c48d172fa81e.png)
![clip_image002[8] clip_image002[8]](http://advisoranalyst.com/glablog/wp-content/uploads/HLIC/87643c35c15047b53fb4599fb537ff17.png)
![clip_image002[10] clip_image002[10]](http://advisoranalyst.com/glablog/wp-content/uploads/HLIC/f6f891bbc1bd625328d1471b8a6e4a8b.png)
