Summer is upon us, and turning our attention to the lakeside or campsite feels most appropriate, if not natural. However, let us engage briefly and use this weeks Equity Leaders Weekly to visit a topic that seems to remain relevant across the globe: Crude Oil prices. We will explore once again the Crude Oil Continuous Contract (CL.F) and its recent price movement. The media is ripe with opinions on where Oil prices are headed and what driving factors are causing the recent Oil direction. For the second chart this week, we will examine and evaluate the iShares U.S. Oil and Gas Exploration ETF (IEO). We will look at one of the most common investment vehicles retail investors use to gain exposure to the commodity itself.
Crude Oil Continuous Contract (CL.F)
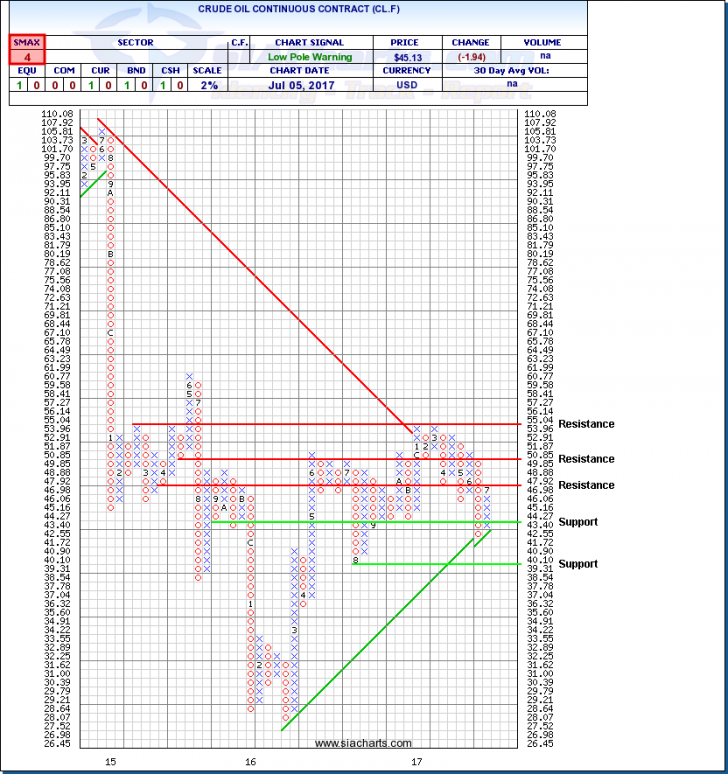
Here we go again. Oil prices try and push higher, surging in the past week, only to fall sharply snapping the longest winning streak this year, remaining in a longer-term bear market. It may be talked about a lot in the media but oil continues with its relevance as it affects so many industries. Since 2015, prices have remained depressed and range bound between $30 - $60, and mostly between $40 and $55. Closing ~4% down as of yesterday, CL.F struggles to find a consistent course of direction.
Resilient U.S. shale drilling, underwhelming progress towards OPEC’s goal in slimming global oil inventories, and output recoveries from nations exempt from the deal to curb production, like Libya and Nigeria, are all contributing factors to the continued volatility and range bound nature of oil prices. Most recently, it is the increased shipments coming from OPEC members and commentary coming from Russia that is putting downward pressure on prices. Opposing deeper cuts, Russia believes this would send a message that the current pact to reduce output is not doing enough to support prices already.
The many moving parts of the oil market have left market participants nervous, even scaring off investment from the space in some cases. There is no easy answer on where and when to add or remove exposure, but we can look at the relative strength to help us understand what the supply and demand is showing us to make the best decisions possible. Evaluating from a technical perspective shows Commodities as the lowest ranked asset class, with Crude Oil closing yesterday at $45.13 CL.F could look for support at $43.40. From there, watch support right around $40. To the upside, resistance is found at $47.92 (a previous support level), and also found at $50.85 and $55.04.
iShares U.S. Oil & Gas Exploration ETF (IEO)
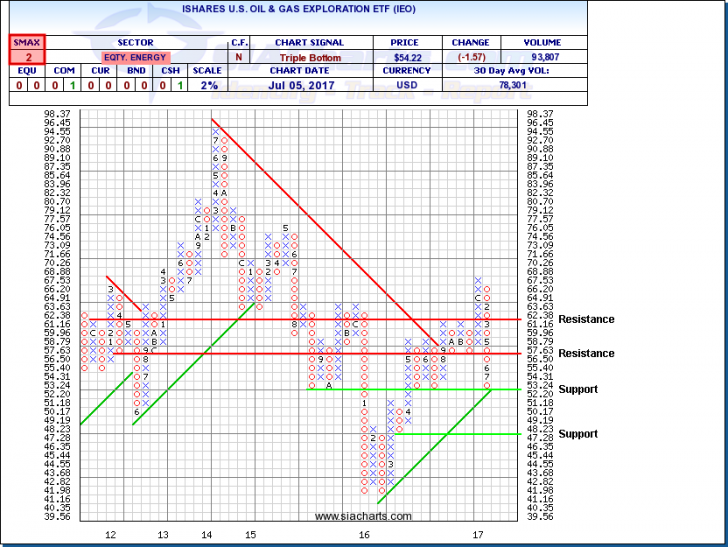
With oil being a component (or core component for some), IEO can be used as a ETF position when adding crude exposure. However, the question today is whether to add exposure, reduce exposure, or eliminate exposure altogether. It would appear most forces in the market are working against a continued and sustained rally taking hold. OPEC exported 25.92 million barrels a day in June, up 450,000 from May, is not showing the market that any OPEC deal can slow production output themselves.
A glut of negative news regarding oil prices is affecting energy stocks and directly putting pressure on such diversified investments like the iShares U.S. Oil & Gas Exploration ETF (IEO). Although there are analysts that believe oil prices should reside in the low $50’s with current fundamentals, we prefer to look at IEO from a technical angle to gain perspective on this position.
As of the close yesterday IEO was trading at $54.22. We appear to be at a rather significant crossroads with a material support level coming in $52.20. A breach of this level may find it’s next support level just above $47. If a positive story were to begin developing around crude oil production, supply and prices, watch for resistance to come in at $57.63 and then again at $62.38. With a negative SMAX of 2, IEO is exhibiting weakness across the asset classes on a near-term basis.
SIACharts.com specifically represents that it does not give investment advice or advocate the purchase or sale of any security or investment. None of the information contained in this website or document constitutes an offer to sell or the solicitation of an offer to buy any security or other investment or an offer to provide investment services of any kind. Neither SIACharts.com (FundCharts Inc.) nor its third party content providers shall be liable for any errors, inaccuracies or delays in content, or for any actions taken in reliance thereon.
For a more in-depth analysis on the relative strength of the equity markets, bonds, commodities, currencies, etc. or for more information on SIACharts.com, you can contact our sales and customer support at 1-877-668-1332 or at siateam@siacharts.com.
Copyright © SIACharts.com