by Blaine Rollins, CFA, 361 Capital
It is difficult not to see it, hear it, or feel it. The global expansion continues to gather steam and slowly, but surely, it is making its way through to supply and prices. For anyone in the business less than 10 years, this is how it feels. In Denver, you might raise an eyebrow at another skyscraper going up downtown…until you find out that all of the existing new builds are leased up before the building is completed. Or, you might hear that air freight capacity for upcoming months across the Pacific Ocean is being closely allocated. Or, you might see that one of the largest racetracks in North America being used as a parking lot for a quarter of a million flood-damaged cars and trucks. If you are a Netflix customer you just got a notice that they are raising prices 10%. Once again, Fixed Income managers are going to earn their paychecks over the next 12 months.
Every quarterly earnings period is important, but for the next three weeks the market will be hunting closely for companies who have pricing power and for those who don’t. The market has risen into the earnings period even as earnings estimates have fallen. While some of that is due to the hurricane impacts, the rest is due to some increased uncertainty over pricing power and margins. We know that volumes will be good along with the rest of the global economy, but what we want to see if the ability to absorb and pass along price increases. With that said, good luck with your hand of companies. Let’s deal the cards.
The U.S. economic backdrop going into earnings…
American manufacturing expanded last month at the fastest pace in 13 years, powered by robust order growth and healthy production, figures from the Institute for Supply Management showed Monday.
(RenMac)
The jobs data on Friday was a mess, but still some tea leaves to sift through, especially for rising wage inflation…
In the end, the hurricane distorted September Employment Situation Report did prove to be interesting. Headline Non-farm Payrolls registered a loss of 33,000 jobs, the first loss since 2010. The hurricane effects were obvious in that the Leisure industry lost 111,000 payrolls for the month and nearly 1.5 million people could not work due to bad weather. That 1.5 million compares to the two decade average of 109,000 people. The loss of lower paying Leisure industry jobs likely boosted Average Hourly Earnings where month over month growth matched July’s strong 0.5% reading. The readings are tied for the highest in a decade. The Bureau of Labor Statistics reported the hurricane had no discernable effect on the Unemployment Rate which was 4.2%. That is the lowest reading since 2000. That was accompanied by an increase in both the Labor Force to new all-time highs and the Labor Force Participation Rate to its highest level since March 2014. With the exception of the headline Nonfarm Payrolls print and a likely lower revision for wages this was an extremely impressive Employment Situation Report.
(Jones Trading)
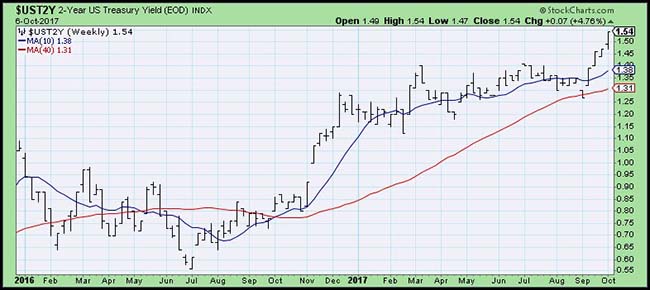
The 2-year Treasury yield continues to take note of the rising economic strength…
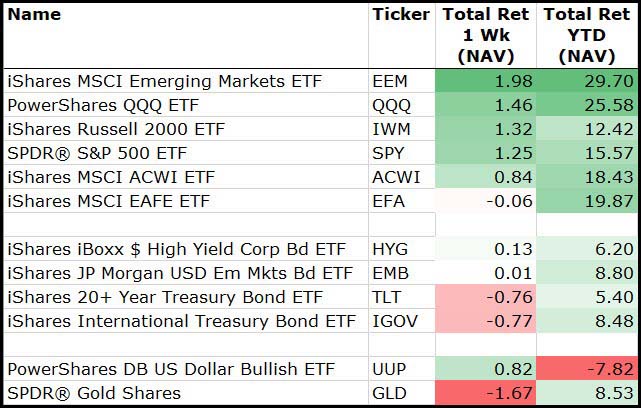
The equity markets are also playing for continued economic strength…
Emerging Markets, Nasdaq and Small Caps led on the week while Bonds and Gold lagged.
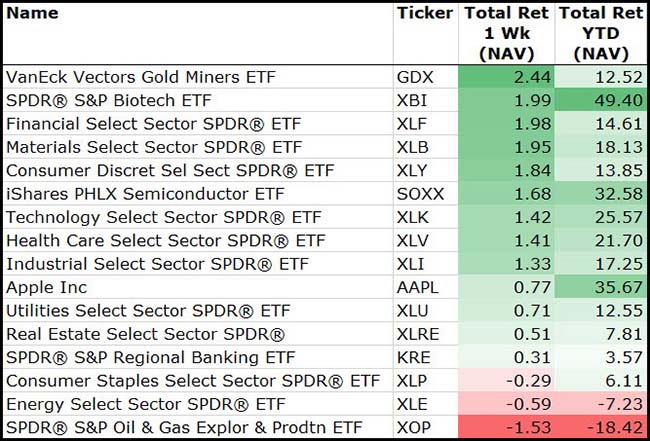
Same at the sector level…
As defensive stocks continue to be a source of funding by managers to buy more economically sensitive and growth sectors of the market.
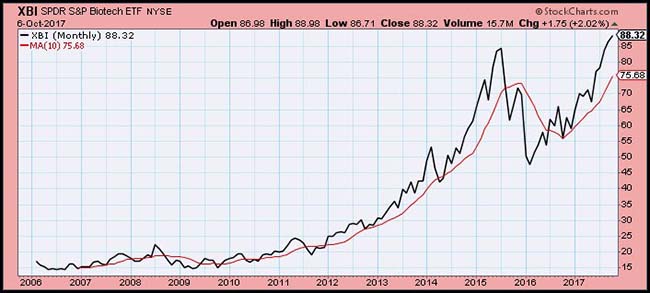
Biotech is in a full sprint as it breaks out to all-time new highs…
Here is that picture of Texas World Speedway…
Hope there is not a race until next summer.
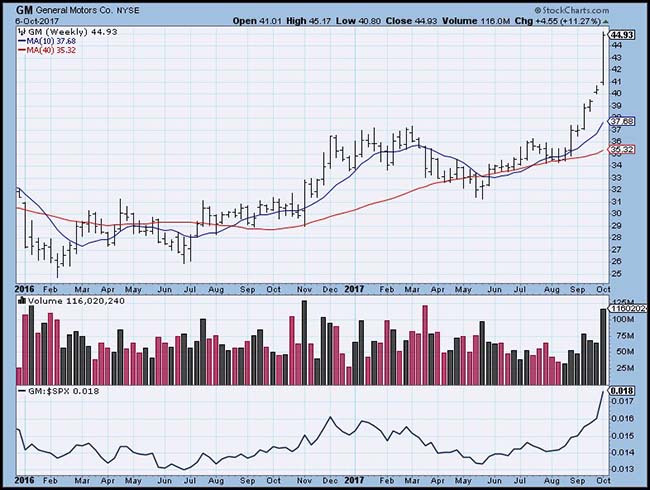
General Motors is getting help from more than just the Hurricanes…
A 30% move is worth much more than just selling an extra 250-500k cars and trucks. Portfolio Managers want to buy GM because they think the company will be selling a lot more autos at higher prices in busier factories. GM just might be the markets single best thermometer right now.
A chart of the German DAX shows you that the economic uplift is not limited to helping U.S. stocks…
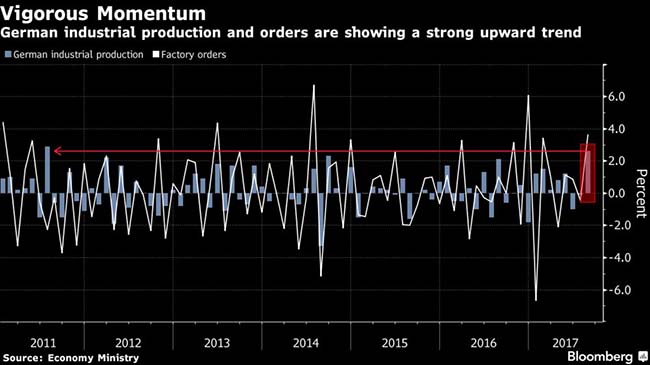
In fact, the German economy is beginning to thump the U.S. economy by some measures…
German industry rebounded from a summer lull with its best month in six years, keeping Europe’s largest economy on a solid footing in the second half of the year.
Output, adjusted for seasonal swings and inflation, increased 2.6 percent from July when it fell a revised 0.1 percent, the Economy Ministry in Berlin said on Monday. That’s the biggest increase since July 2011 and it pushed the year-on-year gain to 4.7 percent.
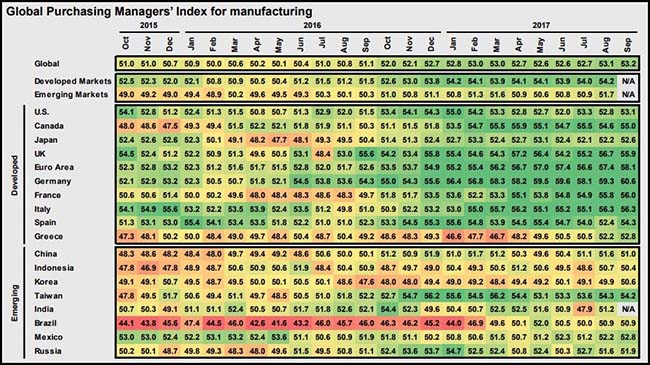
Economic growth can now be see in every major global economy as each PMI is printing > 50.0…
(JPMorgan)
And economists are upgrading their forecasts…
From Wall Street to Washington, economists have been upgrading their forecasts for the global economy this year, with the consensus now pointing to an expansion of more than 3 percent — up noticeably from 2.6 percent in 2016.
Economists from the I.M.F. are likely to follow suit when the fund releases its biannual report on the global economy on Tuesday.
The rosy numbers are noteworthy. But what’s more startling is that virtually every major developed and emerging economy is growing simultaneously, the first time this has happened in 10 years.
“In terms of positive cycles, it is difficult to find very many precedents here,” said Brian Coulton, the chief economist at Fitch, the debt ratings agency. “It is the strongest growth we have seen since 2010.”
(NYTimes)
If you think equities get hurt as rates rise, here is a chart refresher…
We are at 2.3% currently on the 10-year U.S. Treasury yield. Equity markets usually have difficulty when the yield rises above 5%. So hopefully this time is no different.
(JPMorgan)
Pay attention to what Bill Joy is saying…
Sun Microsystems co-founder Bill Joy recently joined Water Street Capital and has pushed the secretive hedge fund firm to build a large stake in Micron Technology Inc., arguing the market for its main product is set for a sustained boom without the wild ups and crushing downs of the past.
The rise of cloud computing, artificial intelligence, and augmented and virtual reality applications on Apple Inc. iPhones and other high-end smartphones will spur stronger demand for DRAM chips, Joy wrote in a recent memo to Water Street founder Gilchrist Berg and other executives at the firm.
DRAM supply is likely to fall well short of this demand as it becomes increasingly difficult and expensive to churn out more capable chips, and a smaller number of manufacturers behave more rationally to maintain profit, Joy added.
These arguments are well-known in the business, driving the spot price of these chips up more than 70 percent in the past year. What’s unusual is Joy’s conclusion that the market for dynamic random-access memory chips — DRAM — will no longer be whipsawed by oversupply and fluctuating demand.
“With the DRAM industry untethered from its highly cyclical past, we believe chip prices and company earnings are going to be and remain higher for longer than investors currently expect,” Joy wrote in the memo, which was obtained by Bloomberg.
Very difficult to argue with this chart of semiconductor performance…
Great food for thought from Bill Nygren…
Higher P/E ratios are also caused by near-zero short-term interest rates because corporate cash now barely adds to the “E” in the P/E ratio. When I started in this business in the early 1980s, cash earned 8-9% after tax. Consider a simple example of a company whose only asset is $100 of cash and the market price is also $100. In the early 1980s, the $8 or $9 of interest income would generate a P/E ratio of about 12 times. Today, $100 would produce less than $1 of after-tax income, driving the P/E ratio north of 100 times. There is, of course, uncertainty as to whether that cash will eventually be returned to shareholders or invested in plants or acquisitions, but it seems that making a reasoned guess about the value of cash is more appropriate than valuing it at almost nothing.
A less obvious factor that is producing higher P/E ratios today is how accounting practices penalize certain growth investments. When a company builds a new plant, GAAP accounting spreads that cost over its useful life—often 40 years—so the cost gets expensed through 40 years of depreciation as opposed to just flowing through the current income statement.
But when Amazon hires engineers and programmers to help it prepare for sales that could double over the next four years, those costs get immediately charged to the income statement. When Facebook decides to limit the ad load on WhatsApp to allow it to quickly gain market share, the forgone revenue immediately penalizes the income statement. And when Alphabet invests venture capital in autonomous vehicles for rewards that are years and years away, the costs are expensed now and current earnings are reduced.
The media is obsessed with supposedly bubble-like valuations of the FANG stocks—Facebook, Amazon, Netflix and Google (Alphabet). The FANG companies account for over 7% of the S&P 500 and sell at a weighted average P/E of 39 times consensus 2017 earnings. In our opinion, the P/E ratio is a very poor indicator of the value of these companies. Alphabet is one of our largest holdings, and our valuation estimate is certainly not based on its search division being worth 40 times earnings. If one removed the FANG stocks from the S&P multiple calculation—not because their multiples are high, but because they misrepresent value—the market P/E would fall by nearly a full point. And, clearly, more companies than these four are affected by income statement growth spending.
In addition, no discussion of stock valuations would be complete without some consideration of opportunities available in fixed income. Many experts argue that investors should sell their stocks because the current S&P 500 P/E of 19 times is higher than the 17 times average of the past 30 years. By comparison, if we think of a long U.S. Treasury bond—say, 30 years—in P/E terms, the current yield of 2.9% results in a P/E of 34 times. The average yield on long Treasuries over the past 30 years has been 5.5%, which translates to a P/E of 18 times. Relative to the past 30 years, the long bond P/E is now 90% higher than average. We don’t think the bond market at current yields is any less risky than equities.
(Oakmark)
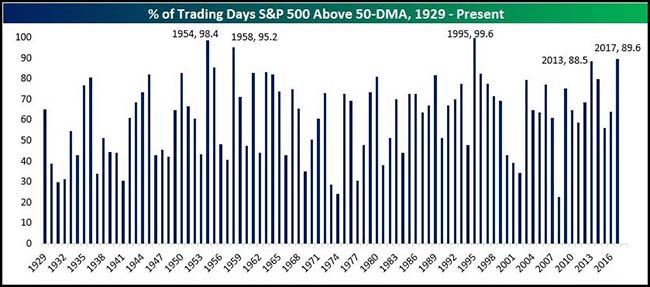
Should this strength be any different?
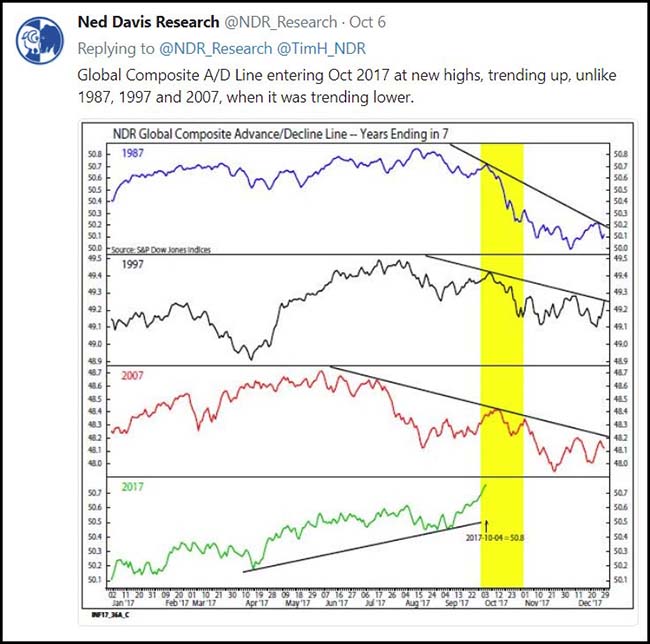
Equity performance years following ’54, ’58, ’95, ’13 were pretty good. Could 2017 offer up similar results for the future?
Maybe the end of the Year ‘7’ phenomenon?
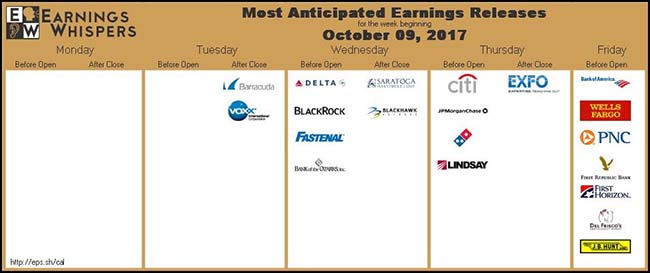
Earnings begin mid week. Here is a visual cheat sheet…
(@eWhispers)
Never a good sign when your stock beats on every earnings metric and it still declines sharply…
Costco delivered nearly everything you could ask for. A better-than-expected profit? Costco’s earnings beat analyst forecasts by six cents a share. Consensus-topping revenue? Total sales rose 16% to $42.3 billion, ahead of estimates of $41.6 billion. Ridiculously good sales at stores opened at least 13 months? Same-store sales rose 5.7%, if we exclude volatile gasoline prices and currency fluctuations. In this retail environment, those are surely results worth celebrating.
Or maybe not. Costco’s shares fell 6% last Friday, as investors saw flaws where they once saw perfection. They point to Costco’s gross-profit margins, which slipped to 13.2% from 13.4% a year ago, and lower membership renewal rates—retail renewals dropped to 89.3% from 89.5%. But there’s another reason Costco can’t seem to catch a break: It’s just too expensive.
After Friday’s earnings report, Costco trades at 24.5 times 12-month forward earnings. While that is well off its June peak of 31.2, it’s still 1.5 times other food and staples retailers, and well above the S&P 500’s price/earnings ratio of 19.3. Normally, that wouldn’t be a problem—Costco almost always trades at a premium—but these aren’t normal times. With Amazon at the controls, Whole Foods started cutting prices. That means everybody in the business will be feeling pressure to do the same.
(Barron’s)
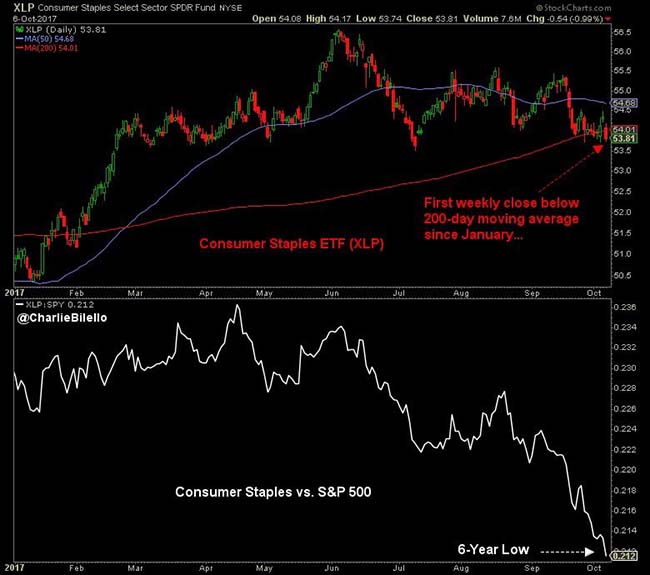
Costco is a 4% holding in the Consumer Staples ETF. The companies that sell everything on its shelves are an 80% weighting…
@charliebilello: Consumer Staples ETF: first weekly close below its 200-day moving average since January, relative strength at a 6-yr low. $XLP
Behavioral Finance Geeks raise a glass tonight…
Congrats to Richard Thaler. Here is our recommended updated scene from ‘The Big Short.’
As a student of the first film, I thought “Blade Runner 2049” was perfect…
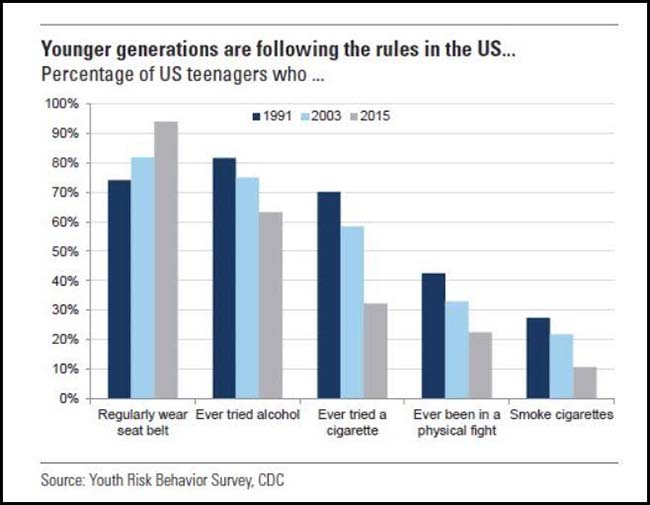
Finally, congratulations on raising a better teenager than yourself…
Now will “socially more responsible” translate into “financially more responsible”? If so, should we clip another couple of points off of our long term VIX projection?
Copyright © 361 Capital

