by Urban Carmel, The Fat Pitch
Summary: US indices closed at new all time highs on Tuesday. The gain was so strong that SPX closed 25% above its Bollinger Band width. This is rare. There have been only 5 similar instances since 2009. None marked an exact short-term top in the market, but all preceded a fairly significant drawdown in the week(s) ahead. Risk-reward over this period was very poor.
There are a host of countervailing reasons to expect equities to end the year higher. This is only one data point, and the sample size is small. Nonetheless, a heads up is warranted.
* * *
Today, SPX, COMPQ, NDX, NYSE, DJIA and RUT all made new all time highs (ATHs). The dominant trend remains higher. Enlarge any image by clicking on it.
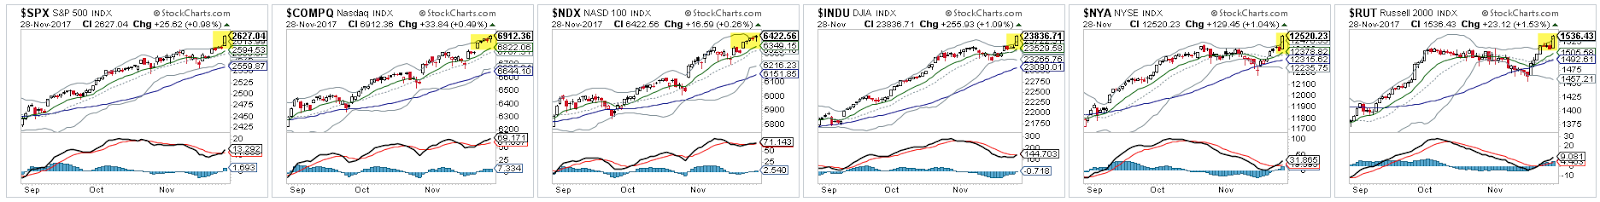
This was the first new ATH since October 20 for the NYSE (comprising some 2800 stocks), indicating that participation in the rally is broadening.
The nominal rationale for today's large gains was tax reform, which now appears more likely to be enacted. There is some risk that investors are buying ahead of passage, which can often be followed by "selling the news" when passaged is actually realized (or if passage subsequently fails).
Today's gains were sufficiently outsized to push the price of 5 of the 6 indices outside their upper Bollinger Bands. Bollinger Bands measure a 2 standard deviation area around the past 20 days' average price. As this area is expected to contain about 95% of the movement of price, a close outside the band is a relatively noteworthy event.
For the S&P, today's gain carried the price 25% above its Bollinger Band width. This is rare, happening only a few times in the past 20 years.
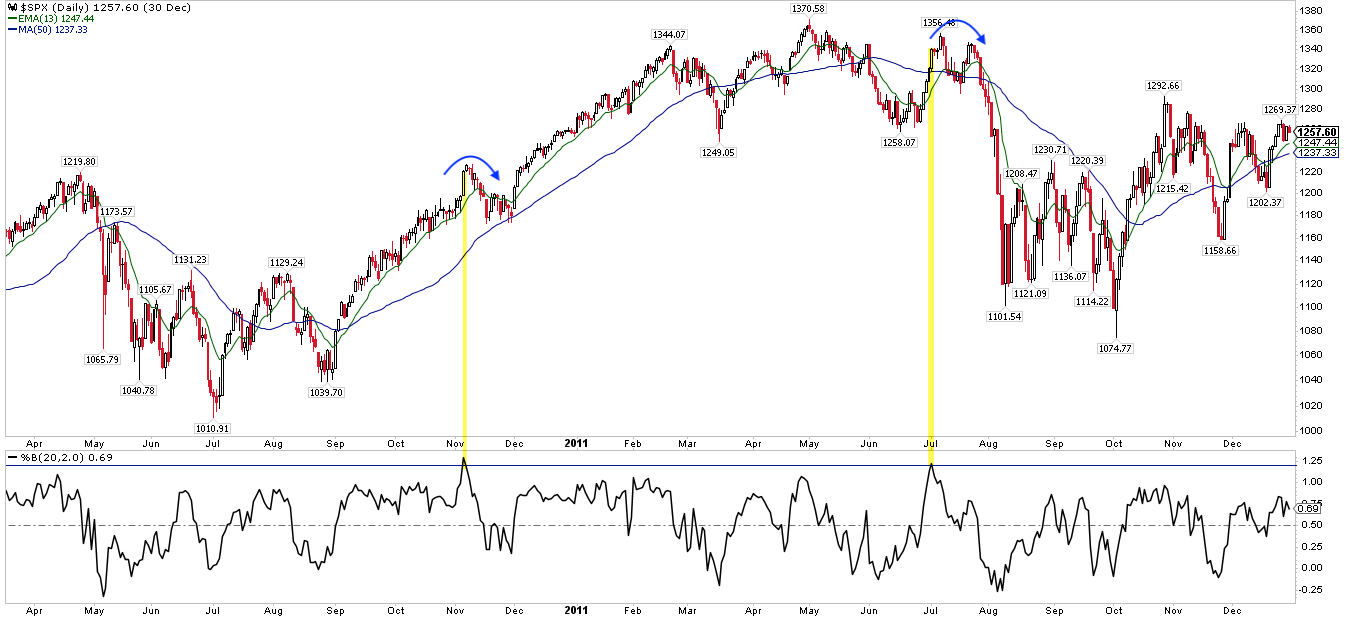
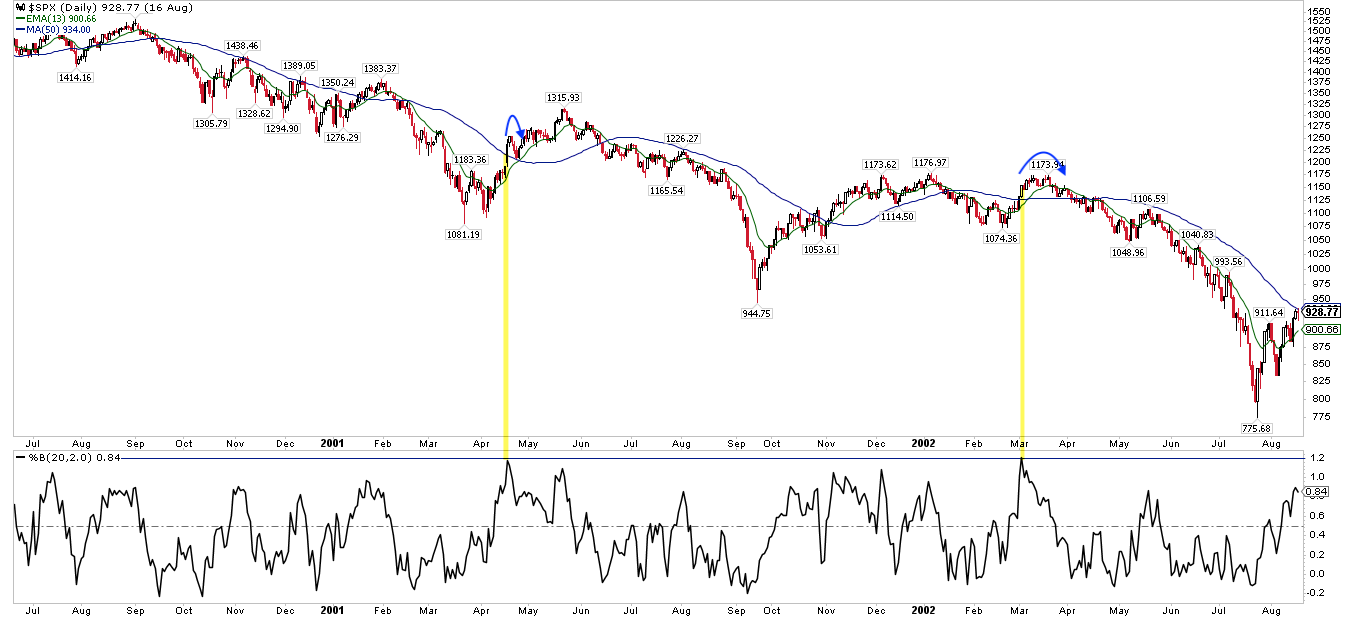
The charts below look at similar instances since 2009, relaxing the criteria to highlight those where the index closed at least 20% above the band's width.
What is noteworthy is that none marked an exact short-term top in the market - price was usually higher the next day or two - but all preceded a fairly significant drawdown in the week(s) ahead. Risk-reward over this period was very poor.
The most recent instance was in April 2013. SPX made a higher close the next day, and then fell more than 3% over the next week.

In September 2012, SPX rose another 2% in the next week, then fell more than 7% over the next 2 months.
In March 2012, SPX rose another 2% in the next 3 weeks, then fell 10% over the next 2 months.

In July 2011, SPX rose less than 1% over the next week, then fell 17% over the next month.
In November 2010, SPX made a higher high the next day, and then fell 4% over the next two weeks.
5 instances is a small sample, and markets are now entering into the seasonally strong month of December. Moreover, there are a host of countervailing reasons to expect equities to end the year higher (most recently here). But it is nonetheless noteworthy that risk-reward has been lopsided and poor in all instances over the next week(s).
Between 2003 and 2008, there was only one additional instance similar to those above, in September 2007. SPX chopped sideways for a week, then gained 3% over the next 2 weeks into its October peak from which the market crashed over the next year.

* * *
Addendum (Added November 29)
The pattern described in this post was more common prior to 2003. Below are additional 18 instances since 1986. Roughly 75% fit the bearish pattern described above; in 5 instances (mostly in 1995-96), SPX continued to rise largely unabated.


Copyright © The Fat Pitch