For this week’s edition of the Equity Leaders Weekly, we are going to look in to the emerging markets international space. We will first look at fixed income opportunities abroad and then at the equities.
iShares J.P. Morgan USD Emerging Markets Bond ETF (EMB)
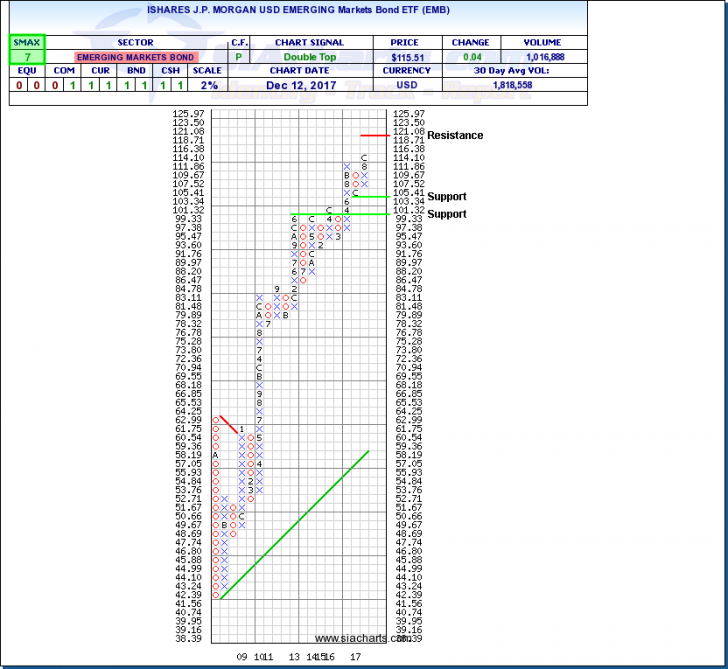
The iShares JP Morgan USD Emerging Markets Bond ETF (EMB) gives investors seeking higher yields exposure to US dollar-denominated government bonds issued by emerging market countries. The sovereign debt nations which this ETF exposes itself too, include 30+ nations such as Turkey, Argentina, Philippines, Russia, Columbia, Brazil, Indonesia, Ecuador, Hungary, and Ukraine, to name a few.
This emerging market bond ETF has been running strong since 2009; EMB is currently sitting with a one-year performance number of over 9% and an annualized three year return at 6.5%. Though this fixed income investment isn't for everybody, the low or even negative correlation to the traditional investment grade government and corporate bond portfolio, allows for diversification within a well rounded bond portfolio.
As can be seen from the attached chart, EMB remains in a strong upward trend and since breaking through resistance at $114, opens for additional gains towards $120. Looking in the other direction, support can be seen below $105, and then $100. With an SMAX of 7 out of 10, EMB is showing near-term strength against the asset classes.
iShares MSCI Emerging Markets ETF (EEM)
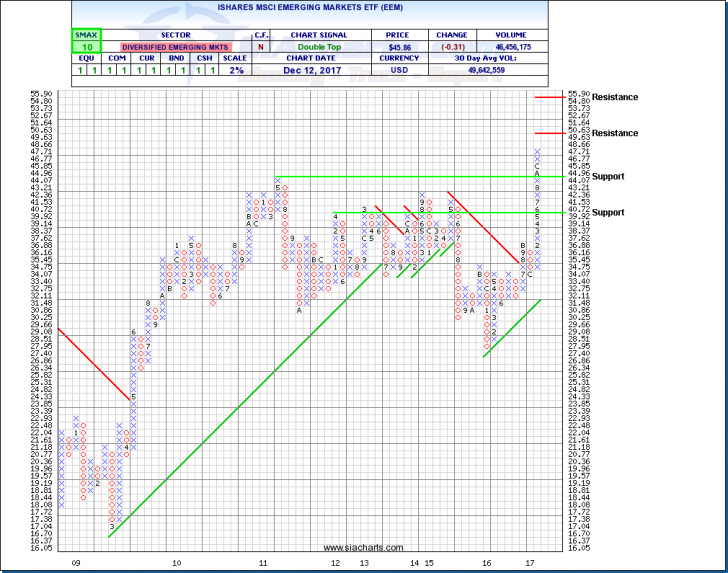
Since last looking at this emerging markets ETF back in August of this year, the shares have managed to break though that 2011 resistance and is continuing its monsterous run onto new all-time highs. For the year to date, the ETF is up a whopping 31%.
As a reminder the iShares MSCI Emerging Markets ETF (EEM) follows 800+ large and mid-capitalization stocks from 21 Emerging market country indexes; this popular ETF gives investors exposure to countries such as China, Korea, Taiwan, India, Brazil, South Africa, and Russia.
Similar to the emerging markets bond, the overall returns have been strong since 2009. Unlike it though, was the fact that the equities ran out of momentum in mid-2011 and formed a consolidation pattern which until recently remained in place. As mentioned earlier, the recent strength has pushed EEM to new highs and the next major resistance will be seen at the $50 and $55 levels. To the downside, support levels can be found around the $44, $40, and then lower around the $30 levels. With a very strong SMAX of 10, EEM continues to show near-term strength against all of the asset classes.
For those looking for ideas within the Emerging Markets to see where this strength is coming from, we recommend checking out the "SIA International Equity Emerging Markets ETF Report" to see which specific Emerging nations are providing the best relative strength and upside going forward.
SIACharts.com specifically represents that it does not give investment advice or advocate the purchase or sale of any security or investment. None of the information contained in this website or document constitutes an offer to sell or the solicitation of an offer to buy any security or other investment or an offer to provide investment services of any kind. Neither SIACharts.com (FundCharts Inc.) nor its third party content providers shall be liable for any errors, inaccuracies or delays in content, or for any actions taken in reliance thereon.
For a more in-depth analysis on the relative strength of the equity markets, bonds, commodities, currencies, etc. or for more information on SIACharts.com, you can contact our sales and customer support at 1-877-668-1332 or at siateam@siacharts.com.
Copyright © SIACharts.com