by Jesse Colombo, Clarity Financial
In my last U.S. stock market update in April, I showed that the major indices were still in a confirmed uptrend despite the volatility experienced in the first quarter of this year. Despite a large amount of seemingly bearish and threatening news – from tech scandals to geopolitics – the market’s rally has continued over the past several weeks. In this market update, I will show the key levels that traders should watch to help determine if the U.S. stock market can break out to new highs or if another wave of weakness is ahead.
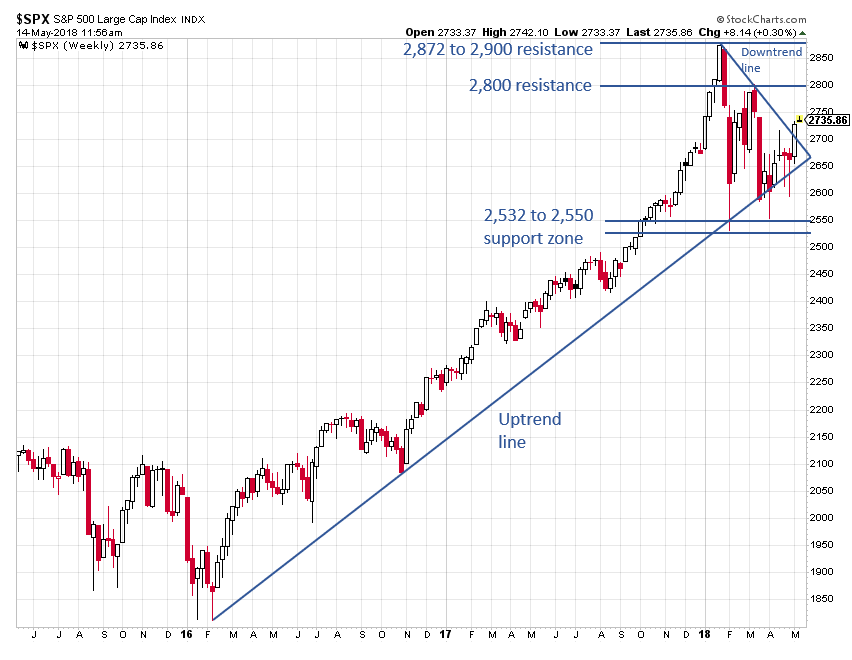
Last week, the SP500 experienced a breakout above its downtrend line that started in late-January, which is a bullish sign as long as this breakout remains intact. The 2,800 resistance is the next hurdle that the SP500 needs to clear. If the SP500 can successfully clear 2,800, the 2,872-2,900 resistance zone (the January 2018 highs) is the final level that needs to be broken in order for the next phase of the bull market to begin. If the SP500’s recent breakout fails and leads to another wave of weakness, however, the two year-old uptrend line and the 2,532 to 2,550 zone (the 2018 lows) are the key supports to keep an eye on.
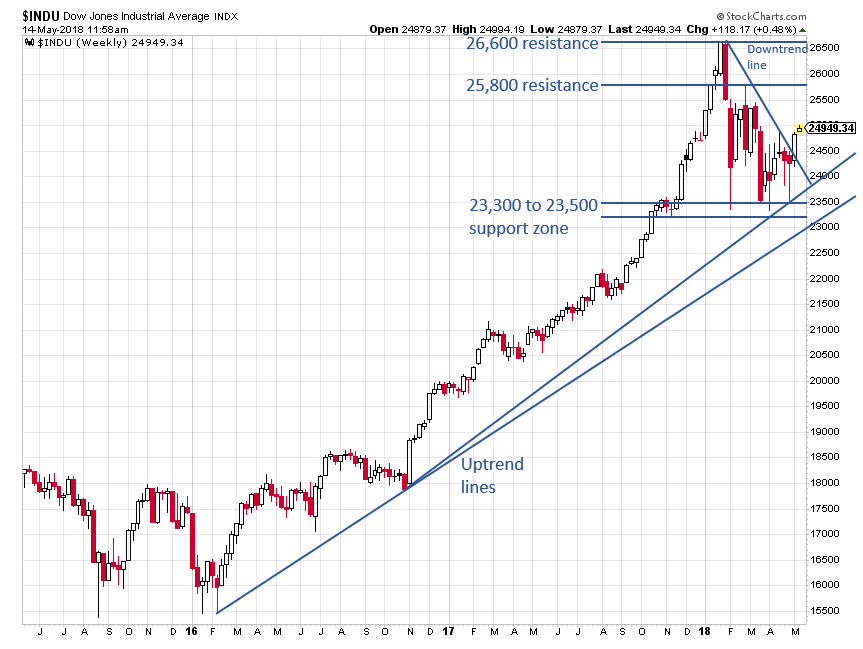
Like the SP500, the Dow Jones Industrial Average broke above its downtrend line last week. 25,800 and 26,600 (the January high) are the next major resistance levels that the index needs to break above in order for the bull market to continue. If last week’s breakout turns out to be a dud, however, the uptrend lines and the 23,300 to 23,500 support zone (the 2018 lows) should be watched carefully.
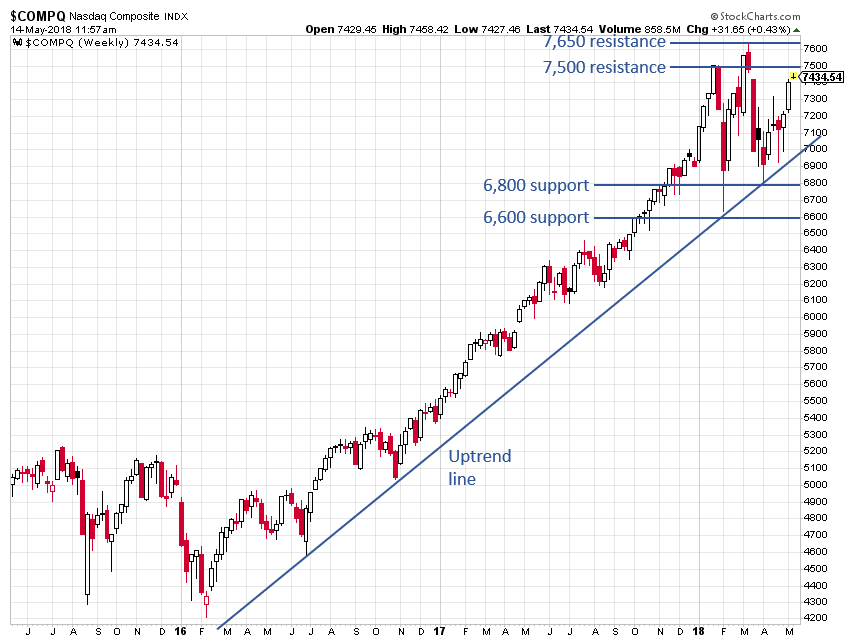
The tech-heavy Nasdaq Composite Index is approaching its major resistance levels at 7,500 and 7,650. These levels need to be broken in a decisive manner in order to confirm the next leg of the bull market. If the Nasdaq fails to break above these levels and another wave of weakness ensues, the two year-old uptrend line and the 6,600 and 6,800 levels are the key supports to pay attention to.
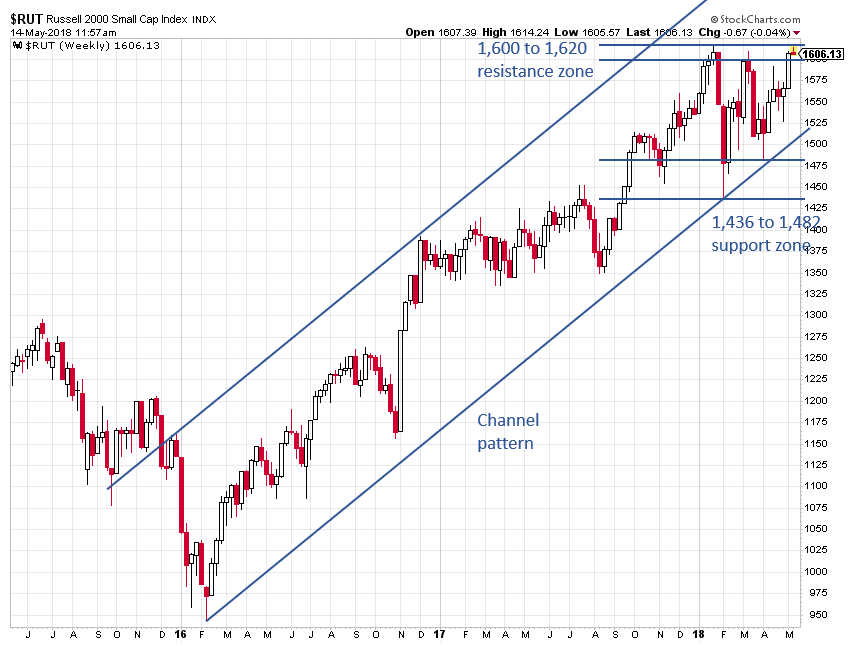
The small cap Russell 2000 has held up quite well despite the volatility in Q1 2018. The index has remained within its bullish channel pattern, which means that the uptrend is still intact. The index needs to clear its 1,600 to 1,620 resistance zone in a convincing manner in order to give another bullish signal. In the event of another wave of weakness, the bottom of the two year-old channel pattern and the 1,436 to 1,482 zone are the most important support levels to watch.
For now, traders should watch last week’s breakout to see if it has staying power. Many nascent breakouts of the past couple months have failed and led to subsequent bearish moves. In order to be extra sure that the market is in the clear this time around, traders may want to wait for the indices to break above their next overhead resistance levels for additional confirmation.
Copyright © Clarity Financial