In recent issues of the Equity Leaders Weekly, we have been highlighting emerging trends across world markets. This week, a number of these trends have crystallized with the US Dollar rallying, the US 10-year yield breaking out over 3.00% and the WTI crude oil price advancing on $75.00. These moves have been sparked by anticipation that US interest rates could continue to rise toward 3.00% over the longer term supported by comments from Cleveland Fed President Mester and strong US economic numbers including retail sales, Empire manufacturing and industrial production.
The increased headwinds from higher interest rates put an end to a seven-day winning streak for the Dow and overall it appears that the sideways trend of the last three months could persist for some time to come. Earnings reports for the next week are dominated by US retailers with investors looking for signs of life from the survivors of the 2017 retailer shakeout.
In this week’s issue of Equity Leaders Weekly, we look at how gold has been steamrolled by the advancing US Dollar and the changing political landscape. We also investigate renewed interest in the marijuana sector.
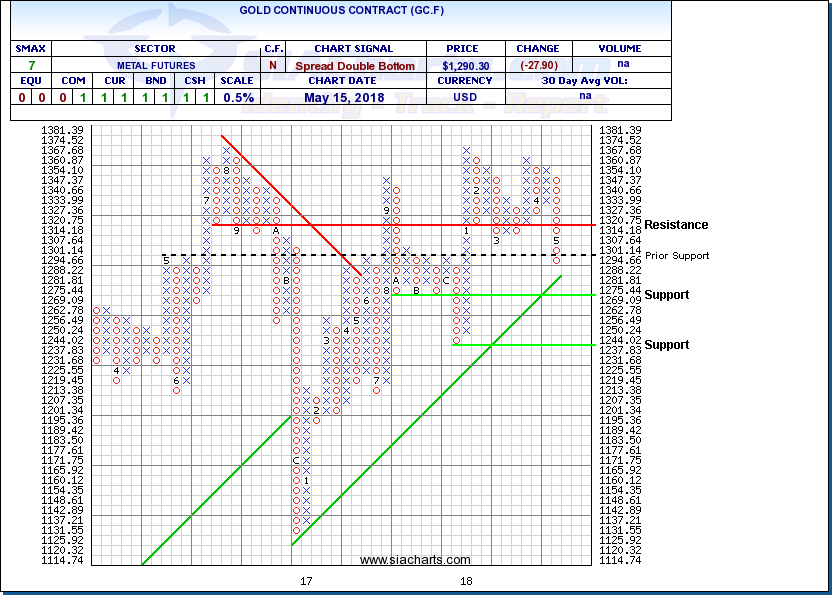
Gold Continuous Contract (GC.F)
As a widely regarded store of value and the world’s premier hard asset, gold often trades in opposition to the US Dollar, the world’s premier paper asset. Gold also often acts as a safe haven during times of volatility and risk.
Both of these forces have turned against gold lately. The prospect of higher US interest rates has sparked a rebound in the US Dollar putting pressure on other currencies, including gold. The breakout of the US 10-year treasury yield over 3.00% this week sparked a big selloff in gold, driving the metal price down below the $1,300/oz level.
Meanwhile, market volatility has subsided. The VIX index has dropped back into the 12-16 area, a lot closer to the 8-12 range it spent the second half of 2017 than the 48-52 area where it peaked back in February. In recent days, President Trump has toned down his hawkish rhetoric on trade particularly with the North Korea Summit approaching. Just as political tensions ease in the Far East, the lack of follow through (six months notice for new Iran sanctions doesn’t count) from the US decision to exit the Iran Nuclear Deal has put a lid on political tensions in the Middle East for the moment as well.
Gold’s recent breakdown below $1,300 and then $1,294 has completed a bearish Spread Double Bottom pattern and signalled the start of a new downtrend. Next potential downside support levels appear near $1,269 then $1,237 on trend. It would take a move back above $1,300 at least and more realistically $1,320 to call off the current downturn.
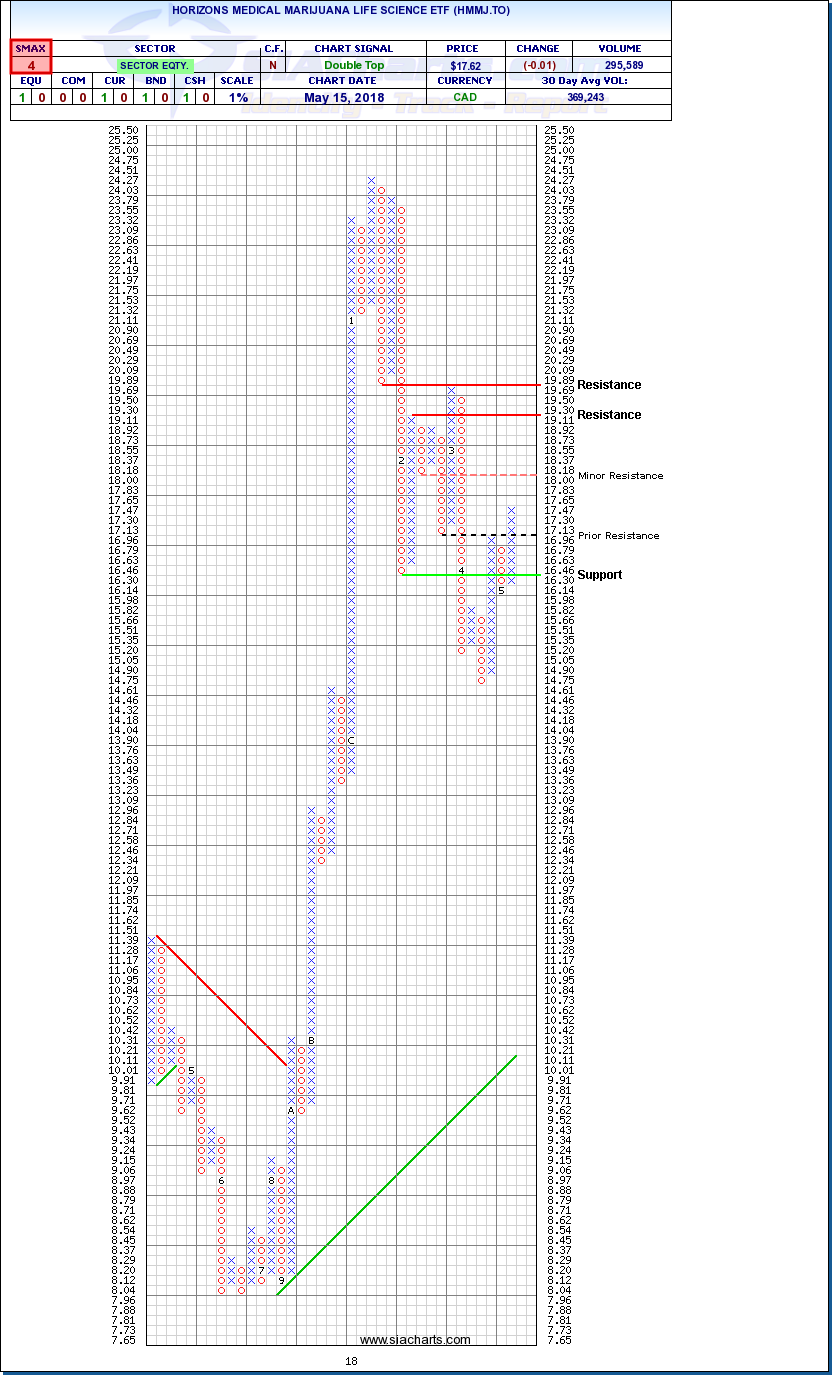
Horizons Medical Marijuana Life Science ETF (HMMJ.TO)
Medical marijuana stocks have been riding a roller coaster over the last year, soaring to great heights and then crashing back down to Earth. It now appears that the weak hands have been shaken out as the sector has been on the rebound lately.
Renewed interest in pot stocks appears to be coming from two areas. First, sector leader Canopy Growth (WEED.TO) recently announced that it has applied to list its shares on the New York Stock Exchange which could give it a lot more visibility with US retail and institutional investors and help to move the sector from the fringes to the mainstream of the investing universe. Second, although the timing and details about distribution and taxation sketchy, the move toward full legalization of marijuana as soon as this summer continues.
Having dropped from near $24.50 toward $14.50 before finally bottoming out, shares of the Horizons Medical Marijuana ETF have been on the rebound lately. The recent breakout over $17.13 completed a bullish Double Top pattern and signaled the start of a new upleg. Upside resistance tests may appear near $18.18 followed by $19.30 then $19.89. Initial support appears near $16.30.
SIACharts.com specifically represents that it does not give investment advice or advocate the purchase or sale of any security or investment. None of the information contained in this website or document constitutes an offer to sell or the solicitation of an offer to buy any security or other investment or an offer to provide investment services of any kind. Neither SIACharts.com (FundCharts Inc.) nor its third party content providers shall be liable for any errors, inaccuracies or delays in content, or for any actions taken in reliance thereon.
For a more in-depth analysis on the relative strength of the equity markets, bonds, commodities, currencies, etc. or for more information on SIACharts.com, you can contact our sales and customer support at 1-877-668-1332 or at siateam@siacharts.com.