by Craig Basinger, Chris Kerlow, Derek Benedet, Shane Obata, RichardsonGMP, Connected Wealth
At what point during multi-year droughts do farmers begin to wonder if the rain simply won’t ever come? The climate does change, albeit usually very gradually, and if it has then perhaps farming is not the best use of your time.
How are the value investors of the world weathering their drought? Some have likely started to change their style or even their profession.
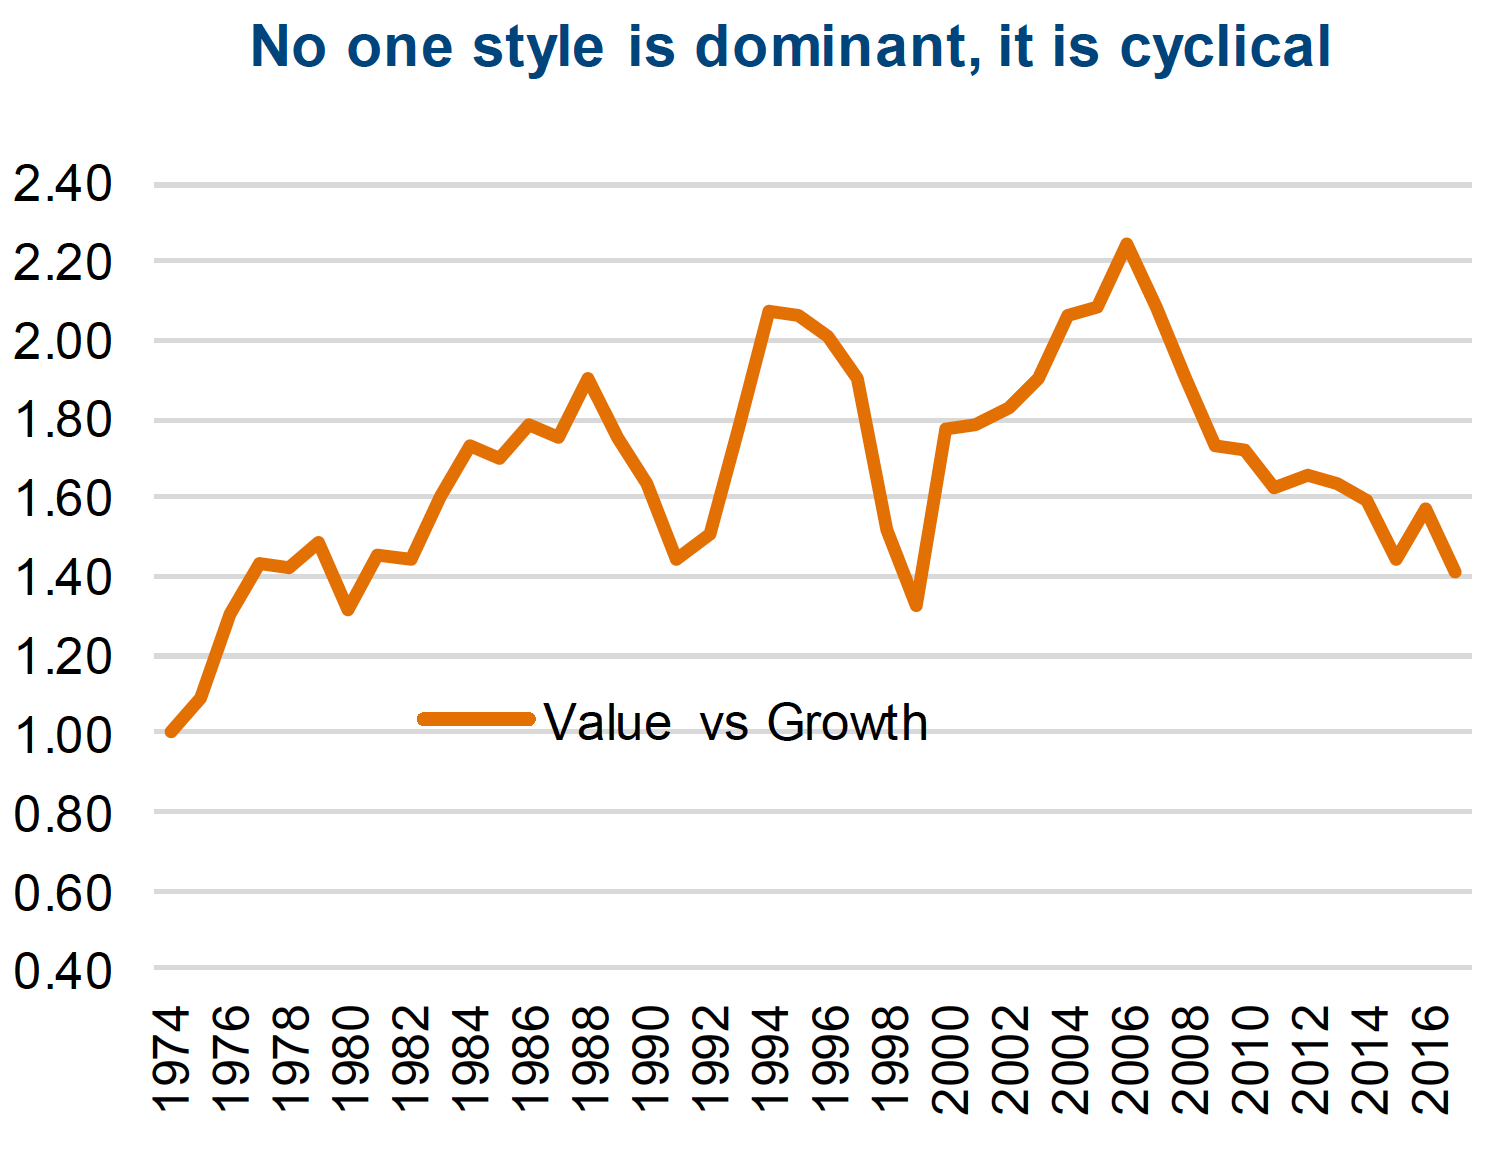
It has been over 11 years of pretty consistent underperformance measured by the S&P 500 Value vs. S&P 500 Growth Indices. This includes a whopping 25% divergence in the past year and a half. The S&P 500 Value Index is up 11% since the start of 2017, but compare that to the Growth Index which is up a whopping 39%. The chart bottom right compares the performance of both indices including a relative performance line in orange. The orange line has been steadily falling since 2007, denoting the underperformance of value relative to growth.
Is Value Dead?
We don’t think that value is dead but a decade of underperformance likely does weigh on both value managers and investor patience, but it is not unprecedented.
Looking at the Value vs Growth chart, there was a run from 2000 till 2007 when growth was the unloved style. Taking a longer term look (top chart on page 2), value investing certainly enjoyed some very good times (and for a long time). From 1974 till 1988 value enjoyed pretty consistence outperformance relative to growth (this also happended from 1991 till 1994). Style investing does tend to work in cycles and while this last cycle has been a long one for growth to be winning, it is certainly not abnormal.
So what has contributed to this period of growth dominance during the past decade? We believe there are a few contributors.
Quantitative easing (QE) and low interest rates are the first. From a math perspective, a company is worth its future estimated cash flows discounted back to today. QE (along with other factors including demographics) has put downward pressure on interest rates. Lower rates means that those future cash flows, even the ones much further out, have a greater value today. For instance the present value of a future dollar of cashflow expected in 10 years time is worth $0.38 if discounted by a rate of 10%. If discounted at 5%, this same dollar is worth $0.61. The discount rate includes uncertainty but also is a funcation of the risk-free rate or interest rates. Since growth companies usually expect greater cashflow farther out, low interest rates are a bigger benefit compared to value companies which often generate more cashflow in the near term.

Another contributor is ETF flows. While there are many ETFs to choose from, the majority of flows continue to be piled into passive market capitization weighted ETFs. The four biggest ETFs in the world are all market cap based, focused on the U.S. equity market and total over $600-billion dollar. As money flows into these ETFs, it results in buying across the entire market (mainly the S&P 500). Since growth has become a larger component of the index over the past few years, this flow continues to feed the growth outperformance relative to value.
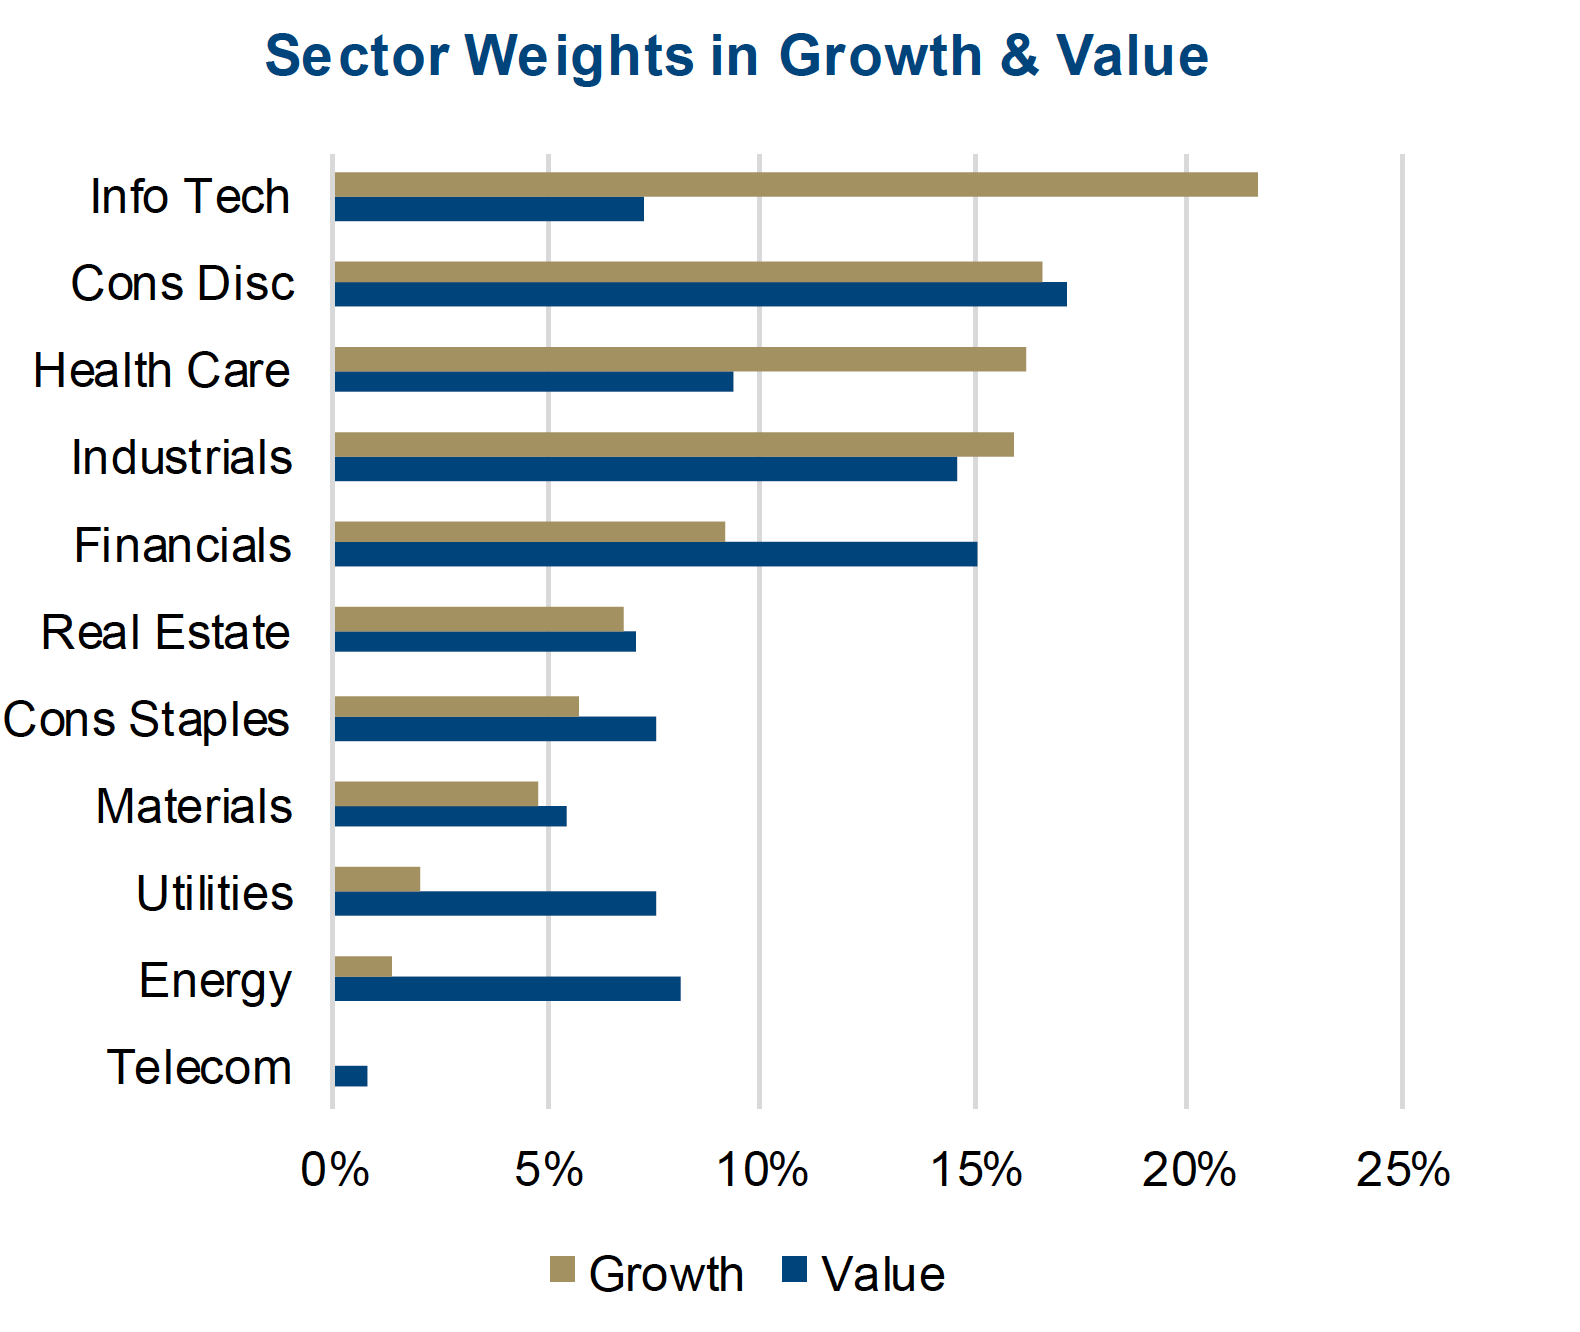
Just looking at the composition of the S&P 500 Growth vs Value Index tells a story (Value vs Growth chart on page 1). The Growth index is dominated by Technology, Consumer Discretionary, Health Care and Industrials. These sectors combined represent 70% of the index. Value on the otherhand is more broadly diversified by sector with much more Finanicals, Utilities and Energy.
It is also worth noting that while it appears both have a good Consumer Discreionary weighting, this masks over some very different holdings. The growth consumer discretionary holdings include companies like Amazon and Netflix while the value index has Ford and Macy’s.
Yet another contributor to growth over value has been the absence of growth over the past decade. Until recently, top line revenue growth was hard to come by for companies as the global economy has elicited a more tepid growth trajectory during this economic expansion. This is a byproduct of a credit driven recession, and this often leads to a slower growth recovery.
When growth is scarce, those companies that are growing tend to attract more capital.
Looks Like Rain
We are not hubris enough to call an end to an 11-year trend, but there is mounting evidence the end of the value drought may be close at hand.
As we mentioned ETF flows are contributing to growth outperformance and this is likely a secular trend as investors change the way they invest, balancing their portfolios with both passive lower cost ETFs with active managers. However, other factors are changing. Bond yields appear to have bottomed and while not rising materially, the trend does appear to be upwards.
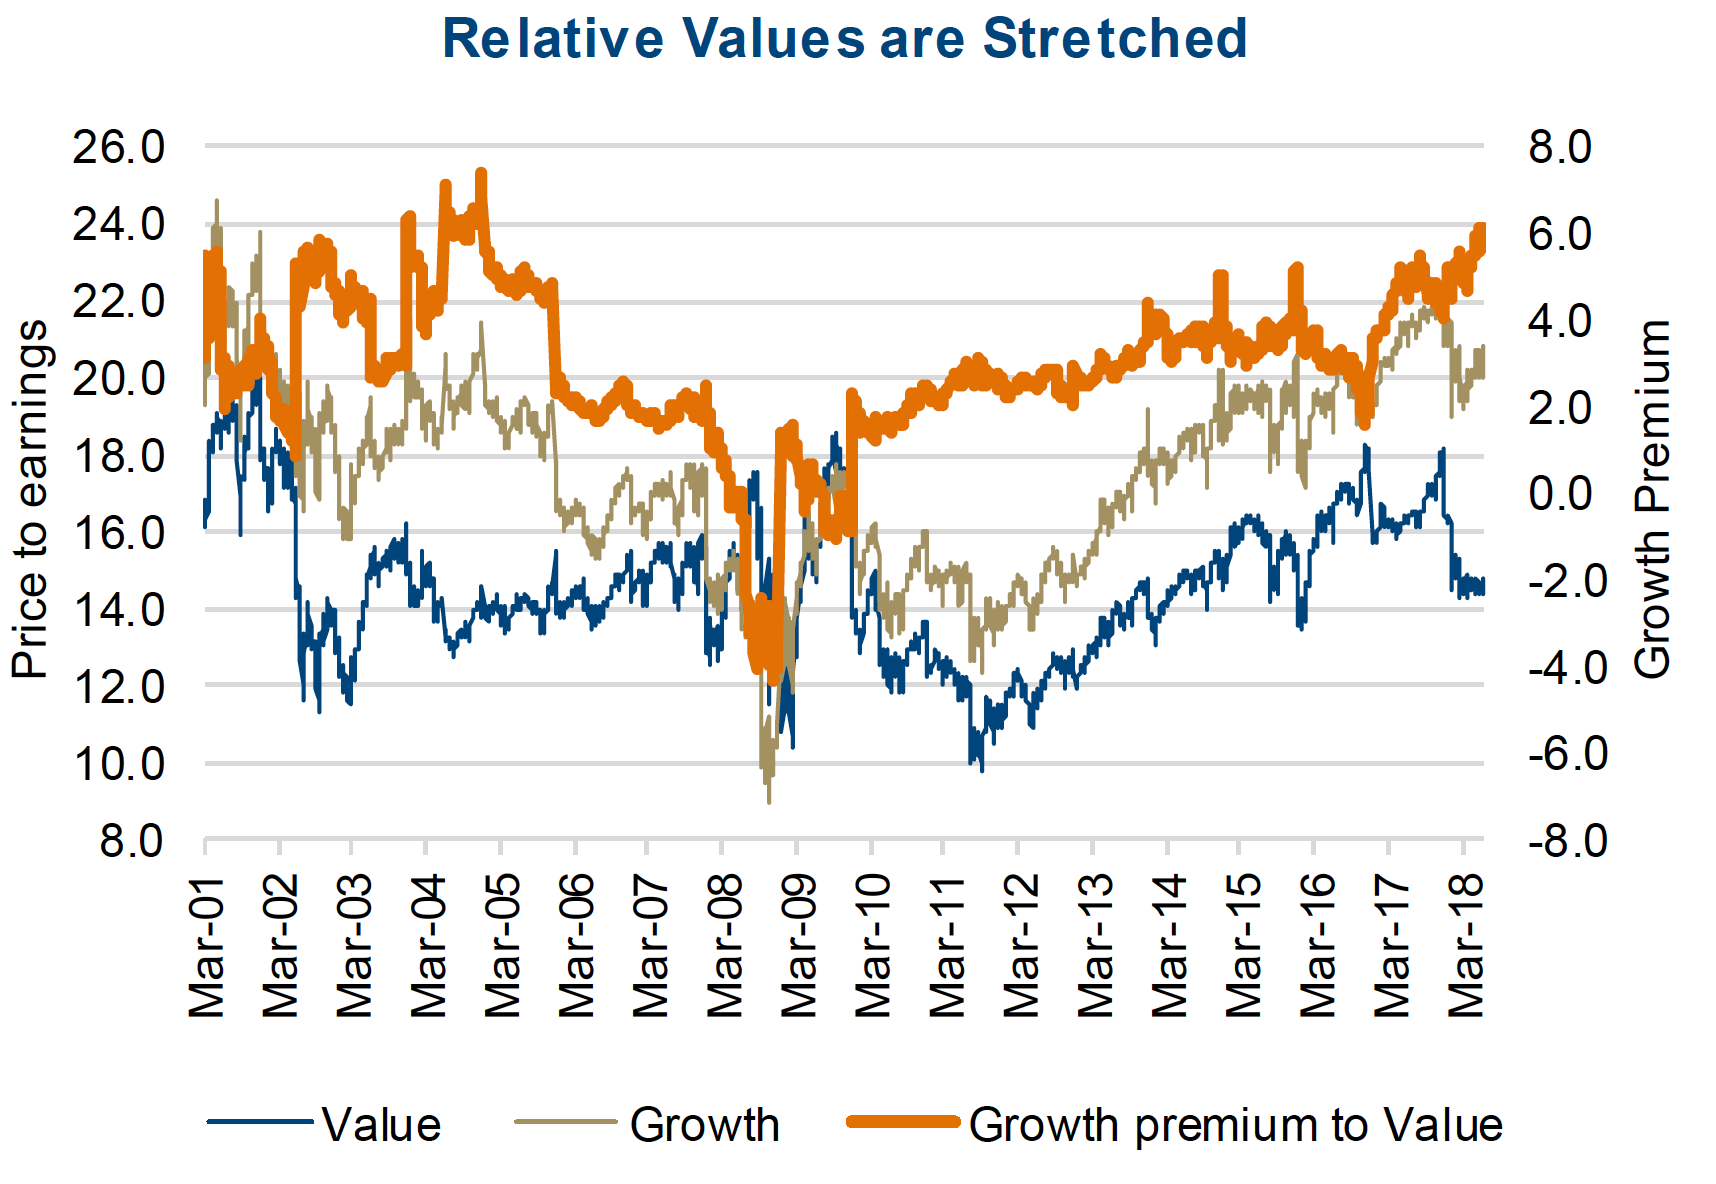
The duration and magnitude of the relative growth outperformance does appear extended, opening the door for at least some reversion if not a cyclical change in direction. The market does have a number of similarities with the late 1990s, when we experienced a seven year run of value outperforming growth. And there is also valuations, comparing the price-to-earnings multiples the premium investors are paying for growth is near the maximum we have seen in decades (Chart 3). Finally, we have a broadening and strengthening of global economic activity, which should reduce the scaricity of companies that are growing.
Portfolio Implications
From a style perspective, we would recommend investors tilt their style allocation a bit in favour of value at this point. In addition to the points above, this view is also supported by our belief the current bull market likely in its late stages and during the next bear market we would expect value to hold up better than growth due to the recent performance and valuation spread.
*****
Charts are sourced to Bloomberg unless otherwise noted. Survey results are sourced from Wikipedia
This publication is intended to provide general information and is not to be construed as an offer or solicitation for the sale or purchase of any securities. Past performance of securities is no guarantee of future results. While effort has been made to compile this publication from sources believed to be reliable at the time of publishing, no representation or warranty, express or implied, is made as to this publication’s accuracy or completeness. The opinions, estimates and projections in this publication may change at any time based on market and other conditions, and are provided in good faith but without legal responsibility. This publication does not have regard to the circumstances or needs of any specific person who may read it and should not be considered specific financial or tax advice. Before acting on any of the information in this publication, please consult your financial advisor. Richardson GMP Limited is not liable for any errors or omissions contained in this publication, or for any loss or damage arising from any use or reliance on it. Richardson GMP Limited may as agent buy and sell securities mentioned in this publication, including options, futures or other derivative instruments based on them.
Richardson GMP Limited is a member of Canadian Investor Protection Fund. Richardson is a trade-mark of James Richardson & Sons, Limited. GMP is a registered trade-mark of GMP Securities L.P. Both used under license by Richardson GMP Limited.
RichardsonGMP, Connected Wealth © Copyright 2018. All rights reserved.