by Jeffrey Saut, Chief Investment Strategist, Raymond James
If one would be successful in speculation, he should keep away from the stock-ticker. It is a fascinating little machine, and any one holding stocks and constantly watching the ticker will have plenty of thrills. But the practice is a deadly one. It may be a good thing for the professional trader to watch, hour by hour and day by day, all the little price fluctuations on the tape, but for the intelligent investor, whose aim is to buy stocks when they are dear, constant watching of the ticker and haunting of brokerage houses, in the belief that consumption of the gossip and rumors circulated there is necessary in order to keep well posted, is an unmixed evil. He cannot hang over the ticker and listen to all the cheap gossip in the brokerage office without having his vision distorted. He will unquestionably abandon gradually his long-range view, and adopt a short-range view of the situation. He will adopt the trader’s attitude almost certainly, and that is fatal.
Instead of holding his stocks through a long market swing, one watching the ticker is more than likely to become disturbed when he sees prices falling a point or two and sell, especially if he is listening to the senseless gossip that passes for speculative wisdom in the average group of ticker fiends. They will say, as prices of stocks react, “They don’t look good to me,” or “These stocks ought to be sold; they can be had cheaper in the morning,” or “This market is in for a reaction.” The first thing he knows, he will be following the rest of the traders, selling his stocks. Then when prices later turn strong, he will buy them back again at higher prices. For then all the talk will be in this strain, “These stocks certainly look good to me,” “These stocks ought to be bought right here,” “I look for a substantial rally in this market.” And so it goes.
. . . Beating the Stock Market, R.W McNeel (1921)
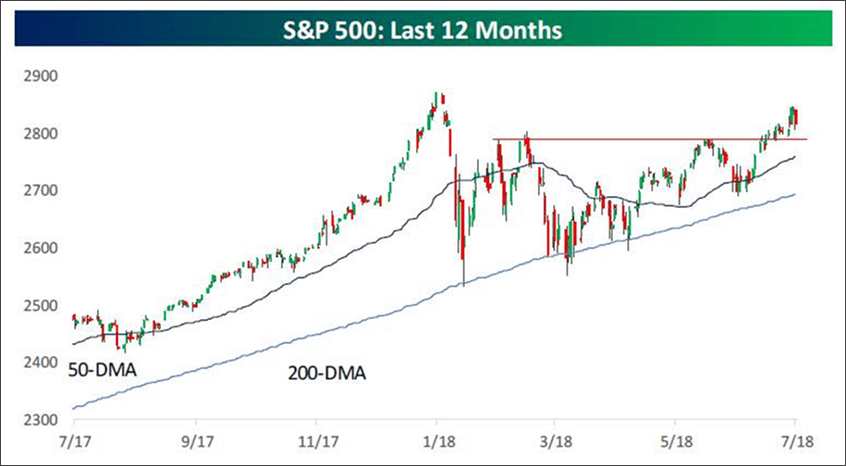
“Do you have the mental fortitude to accept huge gains?” is a line from The Elliott Wave Theorist’s Robert Prechter in an era gone by. But it is as true today as it was when first penned in the 1970s. And to do that, one has to ignore the ticker and hold stocks through a long market swing. Such swings tend to happen once or twice a year. The recent swing, from the February 9th low of ~2532 that we identified, into last week’s intraday high of ~2848, was a good year with a gain of 12.5%. In fact, the S&P 500 (SPX/2818.82) came within 12 points of our long-standing trading target of 2860. Longer-term, however, we continue to think the stock market is going substantially higher. Yet, the late week bombshells from the likes of Facebook (the biggest one-day drop in market cap ever at $119B), Twitter, Intel, etc. proved to be too much on Friday, leaving the SPX off some 0.65% for the session. Still, the SPX continues to reside above the 2790 – 2800 upside breakout level (chart 1 on page 3) and earnings continue to surprise on the upside.
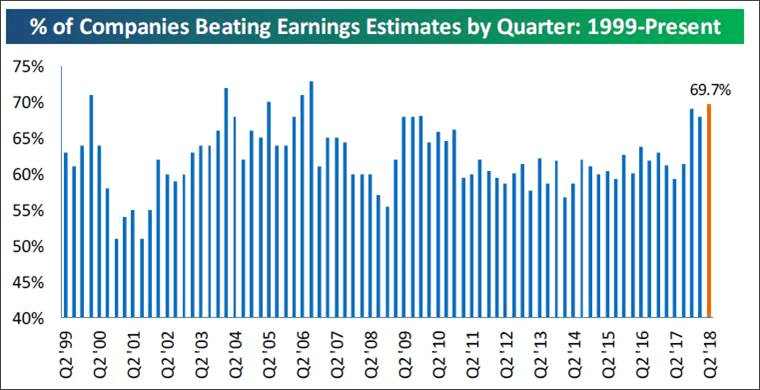
Earnings season is now in full swing with 729 companies reporting since earnings season began. So far, 69.7% of the companies reporting have beaten the estimates, while 67.3% have bettered revenue estimates (chart 2). As the Bespoke organization notes:
“The EPS beat rate remains above the readings seen in the prior two quarters, and while this number is likely to fall a bit in the coming weeks, it should still finish the season strong compared to the long-term average beat rate of just over 60% that we’ve seen since 1999.”
Bespoke goes on to note:
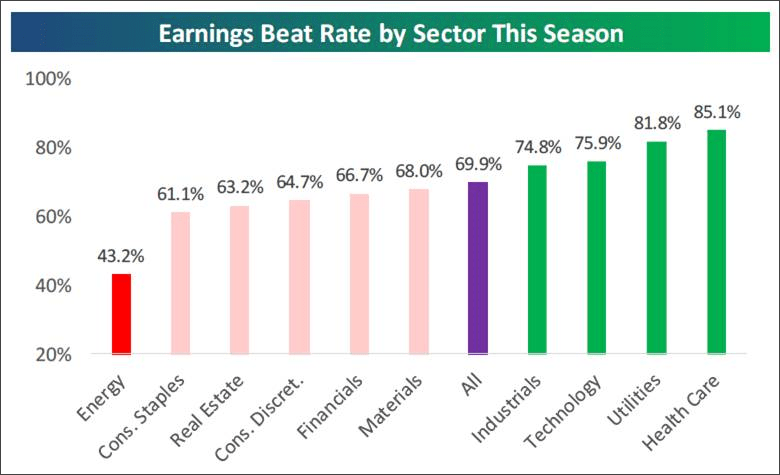
“Staples and Energy have the two weakest beat rates, but these stocks are seeing the biggest jumps on earnings. Health Care and Tech have strong beat rates but their stocks are dropping in reaction on average (chart 3 on page 4).”
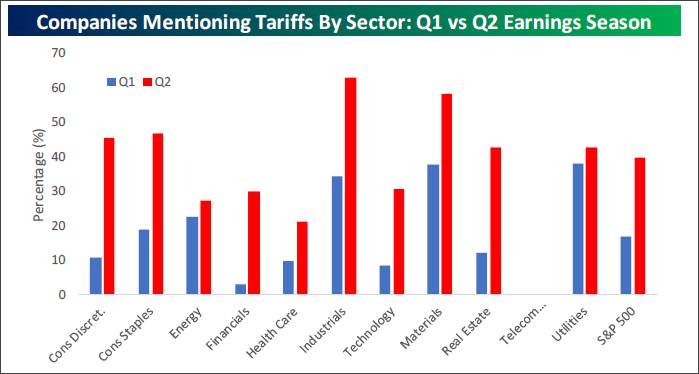
Also worth noting is that some 40% of the reporting companies have mentioned tariffs, with the Industrial and Material sectors having the most mentions. Meanwhile, Consumer Discretionary, Real Estate, Industrials, and Consumer Staples have seen the largest increase in the mention of tariffs (chart 4).
Arguably the biggest driver of the surging earnings growth is the strengthening economy, which was punctuated by Friday’s GDP report. As our economist Scott Brown Ph.D. writes:
“[GDP, at 4.1%, was] about as expected – especially relative to the headline figure -- but surprisingly little revision to the historical data. Consumer spending growth rebounded from a soft 1Q. Business fixed investment remained strong (but not in equipment). What the narrower trade deficit added, slower inventories subtracted.”
To us, the eye-popping figure in Friday’s GDP report was “Real Final Sales,” a truer reflection on the economy, that came in at a very strong +5.1%. Recall this figure excludes net exports and the inventory investment categories. Not to mention that “nominal” GDP grew at a 7.1% rate.
Moving on to the equity markets, historically the month of August has seen mixed returns. However, this is a mid-term election year, and given that the past four months have shown positive performance, history suggests strong performance for the balance of the year. As previously stated, the SPX still resides above its 2790 – 2800 upside breakout level. Moreover, over the past two weeks the SPX is better by some 1.5% and has traveled above the aforementioned breakout level. Such a rally would cause one to think investor optimism would be rising, but the exact opposite is happening (wall of worry?). Concurrent with that is money flows have been coming out of domestic equity mutual funds and ETFs, which is NOT how major market tops occur (chart 5 on page 5).
Turning to some indicators, the NYSE Advance-Decline Line (A/D) still acts pretty perky and there has been no pickup in Selling Pressure. That said, as we wrote last week, the internal energy mix for the SPX turns more cautious the middle of this week, but since the February 9th low a lower energy mix has not led to much downside follow-through. On another cautionary note, the market-leading small caps, as defined by the Russell 2000 (RUT/1663.34), has broken down and broken below its 50-day moving average, ending its longest such streak ever (chart 6) and the S&P 600 Small Cap A/D line is breaking down, as is the small cap Relative Strength Index, and the Option SKEW Index is flashing red. These changes, accompanied with the breakdown in the FANGs, are suggestive of a change in leadership. Accordingly, we are turning somewhat more cautious on a VERY short-term trading basis for the aforementioned reasons.
The call for this week: A short-term trading top is due after a failed attempt by the SPX to trade out to new all-time highs. However, it is just that, a short-term trading “call.” Finally, readers of these missives know that for the past two years we have counseled that it was time to reduce holdings of passive investments (indexing) and move money back to active money managers. To this point, in this week’s Barron’s Avi Salzman writes:
It’s [been] two years since the performance of active managers bottomed, in mid-2016. At the time, less than 10% of the assets in active funds were beating their benchmarks. Since then, however, almost two-thirds of the funds in large-cap active mutual funds have out-performed, notes Nomura Instinet’s head of quantitative research, Joe Mezrich. In the first half of this year, 56% of active funds bested the benchmarks for their classes, be they “value,” “growth,” or the safety- conscious style known as “core.”
QED . . . This morning the preopening S&P 500 futures are off about 4 points on worries about DJT’s threat to shut down the government.
Chart 1
Source: Bespoke Investment Group
Chart 2
Source: Bespoke Investment Group
Chart 3
Source: Bespoke Investment Group
Chart 4
Source: Bespoke Investment Group
Chart 5
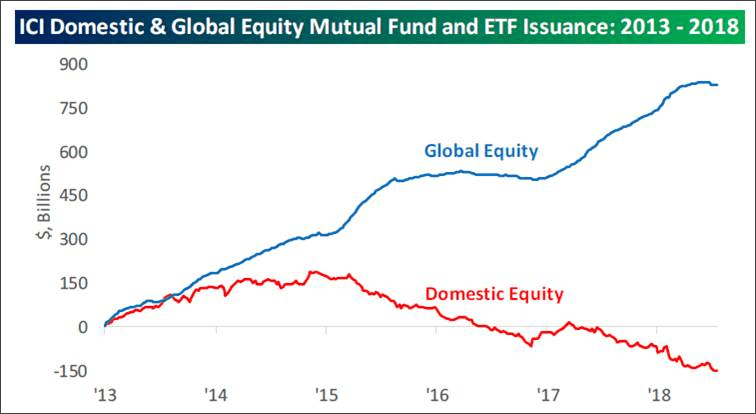
Source: Bespoke Investment Group
Chart 6
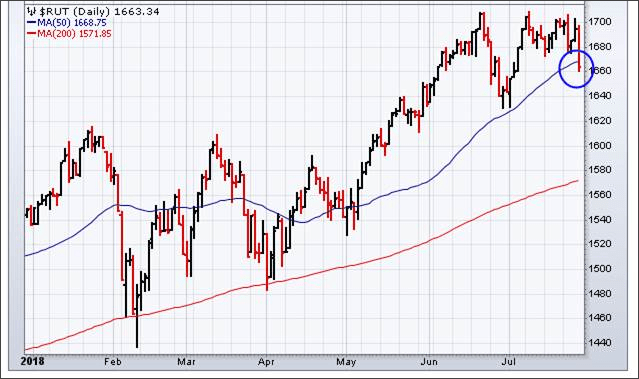
Source: Stockcharts.com
Additional information is available on request. This document may not be reprinted without permission.
Raymond James & Associates may make a market in stocks mentioned in this report and may have managed/co-managed a public/follow-on offering of these shares or otherwise provided investment banking services to companies mentioned in this report in the past three years.
RJ&A or its officers, employees, or affiliates may 1) currently own shares, options, rights or warrants and/or 2) execute transactions in the securities mentioned in this report that may or may not be consistent with this report’s conclusions.
The opinions offered by Mr. Saut should be considered a part of your overall decision-making process. For more information about this report – to discuss how this outlook may affect your personal situation and/or to learn how this insight may be incorporated into your investment strategy – please contact your Raymond James Financial Advisor.
All expressions of opinion reflect the judgment of the Equity Research Department of Raymond James & Associates at this time and are subject to change. Information has been obtained from sources considered reliable, but we do not guarantee that the material presented is accurate or that it provides a complete description of the securities, markets or developments mentioned. Other Raymond James departments may have information that is not available to the Equity Research Department about companies mentioned. We may, from time to time, have a position in the securities mentioned and may execute transactions that may not be consistent with this presentation’s conclusions. We may perform investment banking or other services for, or solicit investment banking business from, any company mentioned. Investments mentioned are subject to availability and market conditions. All yields represent past performance and may not be indicative of future results. Raymond James & Associates, Raymond James Financial Services and Raymond James Ltd. are wholly-owned subsidiaries of Raymond James Financial.
International securities involve additional risks such as currency fluctuations, differing financial accounting standards, and possible political and economic instability. These risks are greater in emerging markets.
Investors should consider the investment objectives, risks, and charges and expenses of mutual funds carefully before investing. The prospectus contains this and other information about mutual funds. The prospectus is available from your financial advisor and should be read carefully before investing.