by Ed Perks, interest rates, Michael Hasenstab, Sonal Desai, Franklin Templeton Investments
There has been a lot of talk the past few years about the flattening of the US yield curve—which is a graphical representation of the spread between short- and long-term interest-rate instruments. More recently, some market commentators have focused on the inversion of one part of the curve—and what it means.
As we mentioned in a prior article, when spreads between short- and long-term rates narrow, it typically suggests the market believes economic growth is not sustainable and will fall in the future.
When the spreads between short- and long-term rates turn negative, or invert, it has been seen as a signal a potential US recession may be looming. As the chart below shows, on March 22, the gap between 3-month Treasury bills and 10-year Treasury notes inverted for the first time since 2007.
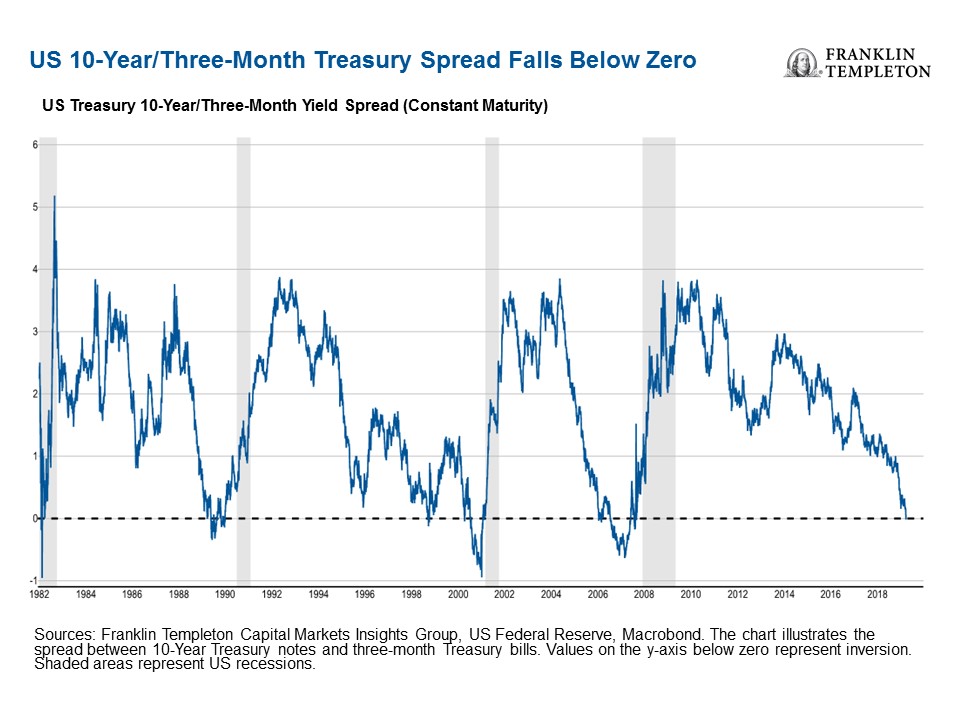
US Yield Curve as a Recession Indicator
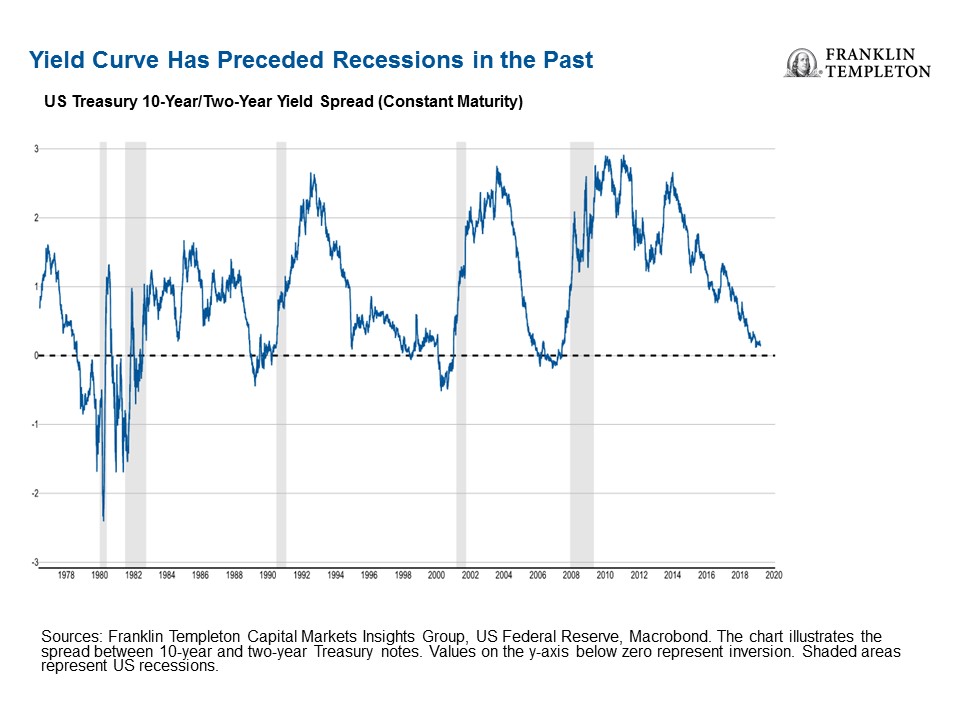
The more widely followed part of the US yield curve is arguably the spread between 10-year and 2-year Treasury notes. As Ed Perks, CIO of Franklin Templeton Multi-Asset Solutions, points out in this article, when that part of the yield curve has inverted in the past, (falls below zero), US recessions have generally followed.
In the past two years, the spread between 10-year and 2-year Treasury notes has hovered below 100 basis points.1 And, as the chart below shows, it narrowed to as low as 11 basis points in December 2018.
Why the Yield Curve Flattens or Inverts
Meanwhile, various fundamental factors have kept a lid on long-term rates in recent years, the long-dated 10- and 30-year Treasury instruments. Some market observers have noted that without another quantitative easing programme, the Fed can’t control the long end of the yield curve.
Simply put, we have seen the Fed raise short-term rates for the past few years without a corresponding rise in long-term rates, causing a flattening and inversion in certain parts of the yield curve.
Why an Inverted Yield Curve May Be Losing Significance
Even if the spread between 10-year and 2-year Treasury yields inverts, some of our senior investment leaders have seen signs the predictive power of the yield curve may not be as powerful as it has been in the past.
In this video clip, Sonal Desai, Chief Investment Officer, Franklin Templeton Fixed Income, says the shape of the yield curve has become meaningless in terms of advising investors as to whether a US recession is imminent. In this era of global quantitative easing, she says prominent central banks are acting on the markets in an untraditional way.
For example, after the financial crisis of 2007–2009, the Fed purchased significant volumes of Treasuries at longer maturity dates. Desai says this Fed buying has impacted the price of securities, meaning that the long end of the yield curve has become a function of market mechanics almost independent of economic growth fundamentals.
“The market is still looking at the yield curve as sending a signal. I just find that baffling.”
In a recent podcast, our senior investment leaders said a US recession is not likely in the near term, despite slowing US economic growth.
Michael Hasenstab, Chief Investment Officer, Templeton Global Macro, said a strong US labor market and supportive consumption should drive US economic activity in the very short term.
“I think there has been too much bearishness, this view that the US is about to enter a recession, or is in a recession, I think that is overstated. However, I do think there are some growing concerns fundamentally about long-term sustainability—this idea of massive reckless deficit spending, the populist politics that lead to uncoordinated and often volatile economic agendas.”
Sonal says there seems to be a consensus that the US is going to enter a recession by the end of 2019 or in 18 months. However, she doesn’t see a triggering mechanism for that recession at this time.
“What I find a little bit more tricky to figure out, in that time horizon, is what is going to cause that recession? Because we do have those strong labor markets, we don’t have, by any means, a hawkish Fed—the Fed is very dovish. [High] Energy prices—another leading culprit—not around. Financial stability and asset-price bubbles, that’s what we are looking at.”
The comments, opinions and analyses expressed herein are for informational purposes only and should not be considered individual investment advice or recommendations to invest in any security or to adopt any investment strategy. Because market and economic conditions are subject to rapid change, comments, opinions and analyses are rendered as of the date of the posting and may change without notice. The material is not intended as a complete analysis of every material fact regarding any country, region, market, industry, investment or strategy.
Data from third-party sources may have been used in the preparation of this material and Franklin Templeton Investments (“FTI”) has not independently verified, validated or audited such data. FTI accepts no liability whatsoever for any loss arising from use of this information and reliance upon the comments, opinions and analyses in the material is at the sole discretion of the user. Products, services and information may not be available in all jurisdictions and are offered by FTI affiliates and/or their distributors as local laws and regulations permit. Please consult your own professional adviser for further information on availability of products and services in your jurisdiction.
Get more perspectives from Franklin Templeton Investments delivered to your inbox. Subscribe to the Beyond Bulls & Bears blog.
For timely investing tidbits, follow us on Twitter @FTI_Global and on LinkedIn.
What are the Risks?
All investments involve risks, including possible loss of principal. The value of investments can go down as well as up, and investors may not get back the full amount invested. Bond prices generally move in the opposite direction of interest rates. Thus, as prices of bonds in an investment portfolio adjust to a rise in interest rates, the value of the portfolio may decline.
_______________________________________________________________________________
1. Basis points are a unit of measurement. One basis point is equal to 0.01%.
Copyright © Franklin Templeton Investments


