by Antonio (Tony) Docal, CFA, Franklin Templeton Investments
A Policymaker-Driven Global Equity Rally
In the first quarter (Q1) of 2019, equities across the globe saw a big recovery from the selloff at the end of 2018. The MSCI All Country World Index was up 12.3% in Q1 2019.1 What drove the rally? In one word, “policymakers,” who switched to a dovish tone. There were fears US interest rates would continue to rise early this year, but the Federal Reserve adopted a more patient approach to policy normalization and communicated a pause in its multi-year tightening cycle.
In a similar manner, the European Central Bank acknowledged economic risks had moved to the downside and delayed potential interest-rate hikes from sometime in the fall of this year to early 2020.
And lastly, China has also signaled monetary easing and numerous stimulus measures including tax cuts, interest-rate cuts, lower bank reserve requirements and also increased spending. Some of these measures are specifically targeting the private sector as opposed to state-owned enterprises, which could result in increased employment growth.
Of the major markets, China, Hong Kong and the United States were the strongest performers, while markets with more modest structural growth prospects, such as Europe and Japan, were slightly less robust. Overall, emerging markets lagged developed markets during the quarter, but both overall saw solid gains nonetheless.2
Investors Flock to High-Growth Sectors
The first-quarter rally favoured high-growth sectors like technology and media and entertainment, which partly explained the strength of the tech-heavy US market and China as well to an extent. On the other hand, traditionally defensive sectors with perceived low-growth characteristics like consumer staples, telecoms and health care were the weakest sectors, as were banks, which didn’t fare as well amid a combination of low growth and lower yields.
That being the case, growth as an investment style outperformed value. The level of growth outperformance was a perfect storm for value-oriented investors who were underrepresented in all of those strong growth sectors and regions.
Growth stocks tend to outperform when economic conditions are weak and financial repression prevails, because companies that can grow organically command a premium in a low-growth environment. We saw parts of the US Treasury yield curve invert during the quarter—where the yield on long-term instruments was less than short-term instruments. Yield curve inversion is often viewed as a precursor to a recession, so it was a double-whammy for value—a growth scare combined with financial repression.
Europe and the Brexit Drama
Turning to Europe, the eurozone economy experienced a traumatic shock in the second half of last year as the slowdown in the United States and China started to impact the continent, particularly export-driven companies. In addition, much of the German auto industry halted production due to new emissions testing standards that came into effect at the beginning of September.
Meanwhile, France has seen civil unrest as the “yellow vest” (gilets jaunes) protestors caused a depression in activity within the eurozone’s second-largest economy. In Italy, the government continued to debate the EU over approval of its budget. All of this led to a lower industrial production and a decline in gross domestic product (GDP) growth to less than 1%.
In the United Kingdom, it’s clear a lot has happened in the Brexit saga over the last quarter, but sadly and confusingly for the market, very little can be considered as progress. Prime Minister Theresa May has secured another extension on the United Kingdom’s exit from the European Union (EU) until the end of October. We have certainly thought a lot about Brexit, and consider that the likely outcome could very well be a so-called “people’s vote” or possibly another referendum due to the deadlock that we have in the UK parliament.
May seems to think she can complete the withdrawal agreement and get approval from parliament before the EU elections at the end of May. Hardline Brexiteers within the Conservative Party think otherwise, and indeed there is speculation that they would like to change the party rules to allow another leadership contest. This remains unlikely, in our view.
On the other hand, the EU is very anxious to avoid being blamed for a hard Brexit, but also wants to ensure this issue does not drag on indefinitely. In our view, the risk is if May’s withdrawal agreement remains deadlocked. In that case, it’s highly likely that the UK Parliament will throw the issue back to the UK electorate for potentially a people’s vote. The vote could ask the electorate whether they would vote in favour of the withdrawal agreement as it stands or with a few minor tweaks; whether they would vote for a hard Brexit, or whether they would revoke Article 50 in its entirety. Another vote would clearly require an extension beyond the end of October.
There is also a possibility of a general election to resolve this deadlock. However, another election would mean going back to square one, and that doesn’t seem to be in the interest of either the Labour or the Conservative party or even the EU itself. And, the uncertainty of the outcome remains.
European Equities Priced for Pessimism
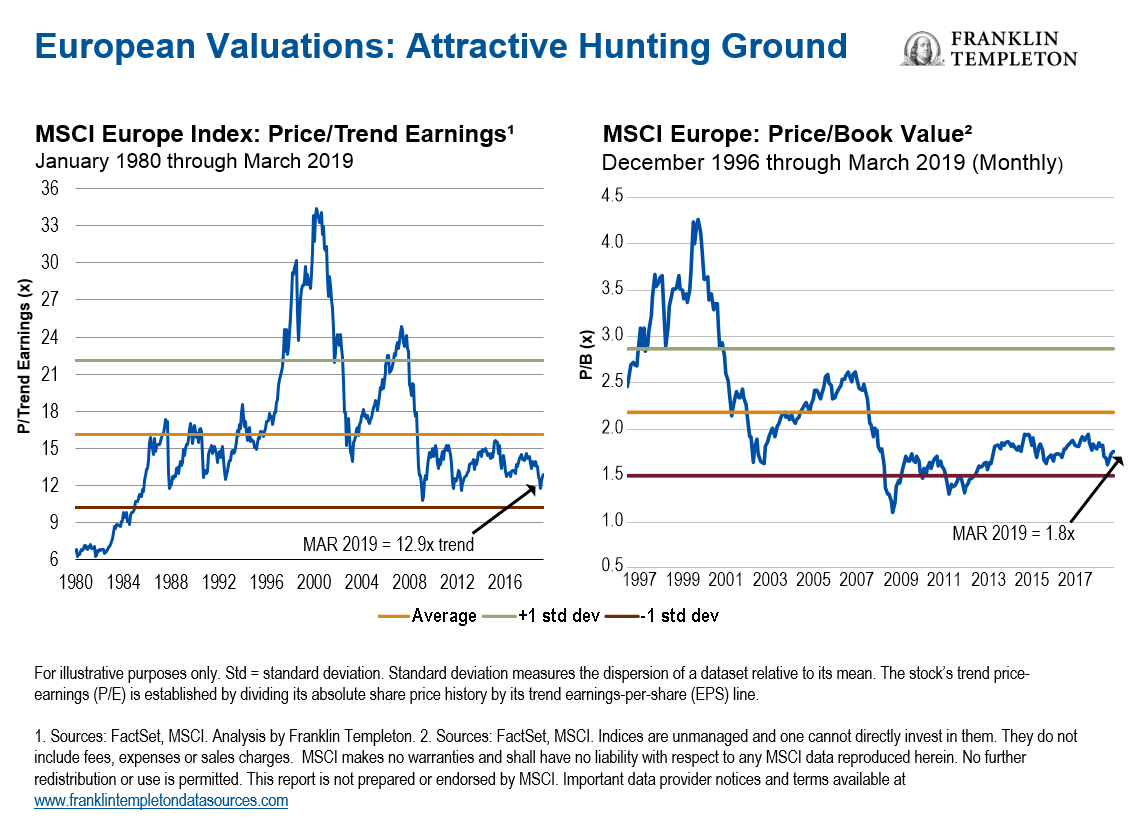
Despite the apparent uncertainty, we still think European stocks are priced to reflect too much pessimism. European equities are currently the cheapest in decades relative to the United States on a price-to-book basis, and the region is the cheapest since the sovereign debt crisis a decade ago on a price-to-earnings basis.3 The consensus is universally bearish, but in our view, European stocks represent some opportunities for value investors, for a few reasons.
Valuations reached levels where we would likely see the stocks start to react on any positive news—or even less-bad news. On the political front, we are seeing signs of progress. In France, it seems like the Notre Dame Cathedral disaster is acting to unify the country in spite of the structural reforms that President Macron is trying to bring in.
In addition, there appears to be progress between Italy and the European Commission in Brussels regarding Italy’s budget. And indeed, the extension of the Brexit process to the end of October has taken Brexit out of the headlines within the region.
In our view, macro indicators are likely to drive a recovery in European equity prices. While the eurozone manufacturing purchasing managers index deteriorated in March, we are starting to see an inflection point in eurozone industrial production, which looks on track to recover.
Retail sales have remained resilient, and other indicators such as the IFO Business Climate Index are looking as if they are likely to rebound this quarter as well.
China’s Headwinds
Chinese stocks have rebounded since the beginning of the year, largely on optimism the US-China trade war would soon be resolved and amid government stimulus measures enacted to counter mounting economic headwinds. China’s 6.4% GDP growth in the fourth quarter of 2018 was the slowest in almost two decades. Exports have also slowed, and consumer prices have continued to lose steam.
While growth in China has been slowing, we think its leaders certainly have the tools to control its economy in the near term, including the ability to manage its capital accounts, exchange rates and the banking system.
China is implementing nearly US$300 billion of fiscal stimulus this year, representing nearly 3% of one year’s GDP.4
China is doing whatever it can to boost growth; indeed, it has already made 70+ stimulus moves in this latest cycle including easier monetary policies, fee reductions and direct lending to the private sector. Fiscal stimulus includes tax cuts and increased infrastructure investments through government bonds. Longer term, we have concerns that such initiatives will only add to China’s structural imbalances, but in the shorter term they should likely prove effective at supporting growth.
Of course, slowing growth in China impacts the rest of the region. With Chinese consumption becoming increasingly important for its regional neighbours, a slowdown in China’s domestic demand can hurt the rest of Asia, especially countries heavily dependent on shipments to China such as Japan, South Korea, Taiwan and Singapore.
However, longer term some of these regional players could actually benefit if the trade war continues to linger because of potential shifts in the supply chains, eventually from China to Southeast Asia. Some of these countries such as Vietnam, India and/or Bangladesh could see increased orders from the United States as budgets shift away from China. South Korea could benefit from US sourcing higher-value items such as electronic equipment and machinery.
Selective Bargains in Japan
In Japan, the government has recently downgraded its economic assessment for the first time in three years, mainly citing slower growth in China as the cause. So Japan’s struggle is actually partly a derivative of China’s. Then there’s also the issue of the second consumption tax, which goes into effect in October of this year. Given the impact of the first tax-hike in 2014 had on the market, there is some trepidation about it. And more generally, Japan’s weakness also likely reflects general concerns about ongoing trade tensions and US President Trump’s trade tariffs, as Japan has a high concentration in the automotive and electronics sectors.
Japan is also one of the few markets in the world that is generally under-owned and trading at a significant discount to its historical valuations. Investor caution relates to legacy issues like low growth, expensive valuations, excessive leverage and poor returns, but over the last few years, conditions have improved.
We have seen corporate governance reform getting traction in Japan, and earnings have risen to multi-decade highs while leverage has also fallen to multi-decade lows. And, according to the Bank of Japan, the Japanese economy has delivered two consecutive years of above-potential growth, which is the longest streak since before the global financial crisis.
More importantly, we believe valuations are becoming more attractive. Japan’s market is trading at a record discount to the US market and the rest of the world, based on price-earnings and book value.5 Structural headwinds such as ageing demographics and high government debt still persist, but Japan has been making progress. We continue to find selective bargains in Japan that are fairly broad-based in terms of a number of sectors, including technology, industrials, communications services, consumer staples health care and others.
Finding Values Worldwide
From an investment standpoint, we believe the best opportunities in Asia are plays on the longer-term wealth accumulation and demand potential of Asian consumers. We are also finding many potential opportunities among providers of critical services and infrastructure such as utilities, telecoms and insurers. And in China, we believe many companies still look attractive based on cheap valuations, although opportunities are selective. To this end, we have largely avoided the state-owned enterprises due to the potential excessive leverage and capacity and focusing instead on some of the consumer and service-oriented sectors in China.
Looking at specific sector plays, we remain committed to health care despite concerns about regulation and pricing. Health care has offered above-average growth in profits and earnings and yet has been trading at lower-than-average valuations both historically, and against some of the other more expensive sectors we see in the global market. The sector is capable of innovating through its challenges and producing products and earnings growth we think the market isn’t yet recognising.
In terms of the technology sector, it is generally looking expensive to us. We have avoided the expensive momentum-driven stocks. Instead, we have been finding opportunities in the more mature, cash-generative software firms as well as some hardware companies with restructuring potential and in semiconductor manufacturers where supply concerns have been an excessive pressure.
Energy stocks got pretty beaten up in the second half of 2018, as the price of Brent crude oil fell to US$50 a barrel. The sector was arguably oversold and due for a potential rebound, which we saw in the first quarter as the price of oil rose some 35% to US$70 a barrel.
When oil starts to recover like it has, it looks less attractive to us, but we continue to see value within the larger integrated oil companies. They have had strong dividends, growing free cash flow and increasing returns.
In consumer staples, value opportunities are likewise highly selective. Investors have generally gravitated towards the perceived winners that are delivering above-average growth, further pushing up already high valuations for these stocks. Over the past few years, the staples companies have countered gross margin pressure with lower overheads and marketing spend. However, as we have seen from the recent loss of market share announced by a number of companies—in both Europe and the United States—it suggests that some companies have cut a bit too deeply.
At the same time, we have seen the grocery channel evolving with retailers investing in e-commerce and private label in order to fend off the rise of alternative platforms such as Amazon and the discount retailers. This is having a negative impact on a lot of manufacturers, particularly in the United States. So within the sector, we are finding opportunities in some of the lowly valued cash generative food and beverage companies that have excess cash flows that could be returned to shareholders.
We also like select food and staples retailers where we believe the industry headwinds are already well- known, but the market is not giving credit for a company’s ability to improve their earnings. At the same time, we are avoiding companies with stretched balance sheets or where the valuation argument is simply not supported by a convincing strategy to generate sustainable growth longer term.
We think that as we move into the second half of this year, there will be more signs that the global growth slump is ending and headwinds are starting to reverse. China’s economy appears to be rebounding, the eurozone economy is starting to accelerate and the US Fed has turned from hawkish to neutral.
Lastly, the US market across various metrics including the Shiller P/E market cap to GDP (known as the Buffett Indicator) and other metrics have now surpassed 1929 high valuation levels, trailing only the extremes found during the technology bubble of the late 1990s.6 And as US corporate earnings come under pressure, we may finally see the beginning of sustained US market underperformance.
That doesn’t mean we’re not investing in the United States though It’s a deep and liquid market with selective opportunities. We’re just not finding enough value relative to the rest of the world to justify the global benchmark’s (MSCI All Country World Index) ~55% weighting to this single market.7
To get insights from Franklin Templeton delivered to your inbox, subscribe to the Beyond Bulls & Bears blog.
For timely investing tidbits, follow us on Twitter @FTI_Global and on LinkedIn.
The comments, opinions and analyses expressed herein are for informational purposes only and should not be considered individual investment advice or recommendations to invest in any security or to adopt any investment strategy. Because market and economic conditions are subject to rapid change, comments, opinions and analyses are rendered as of the date of the posting and may change without notice. The material is not intended as a complete analysis of every material fact regarding any country, region, market, industry, investment or strategy.
Data from third-party sources may have been used in the preparation of this material and Franklin Templeton Investments (“FTI”) has not independently verified, validated or audited such data. FTI accepts no liability whatsoever for any loss arising from use of this information and reliance upon the comments, opinions and analyses in the material is at the sole discretion of the user. Products, services and information may not be available in all jurisdictions and are offered by FTI affiliates and/or their distributors as local laws and regulations permit. Please consult your own professional adviser for further information on availability of products and services in your jurisdiction.
CFA® and Chartered Financial Analyst® are trademarks owned by CFA Institute.
What Are the Risks?
All investments involve risks, including possible loss of principal. The value of investments can go down as well as up, and investors may not get back the full amount invested. Stock prices fluctuate, sometimes rapidly and dramatically, due to factors affecting individual companies, particular industries or sectors, or general market conditions. Value securities may not increase in price as anticipated, or may decline further in value. To the extent a portfolio focuses on particular countries, regions, industries, sectors or types of investment from time to time, it may be subject to greater risks of adverse developments in such areas of focus than a portfolio that invests in a wider variety of countries, regions, industries, sectors or investments. Special risks are associated with foreign investing, including currency fluctuations, economic instability and political developments.
__________________________________
1. Source: MSCI Indices, as at 31 March 2019. The MSCI All Country World Index captures large- and mid-cap representation across 23 developed and 24 emerging markets. MSCI makes no warranties and shall have no liability with respect to any MSCI data reproduced herein. Indices are unmanaged and one cannot invest in them. They do not include fees, expenses or sales charges. Past performance is not an indicator or guarantee of future results. See www.franklintempletondatasources.com for additional data provider terms and conditions.
2. Source: MSCI Indices, as at 31 March 2019. MSCI Emerging Markets Index and MSCI World Index. The MSCI Emerging Markets Index captures large- and mid-cap representation across 24 emerging-market countries. The MSCI World Index captures large- and mid-cap performance across 23 developed markets. Indices are unmanaged and one cannot directly invest in them. They do not include fees, expenses or sales charges. Past performance is not an indicator or guarantee of future results. See www.franklintempletondatasources.com for additional data provider terms and conditions.
3. The price-to-earnings ratio, or P/E ratio, is an equity valuation multiple defined as market price per share divided by annual earnings per share. For an index, the P/E ratio is the weighted average of the P/E ratios of all the stocks in the index. For an individual company, the price-to-book (P/B) ratio is the current share price divided by a company’s book value (or net worth) per share. For an index, the P/B ratio is the weighted average of the price/book ratios of all the stocks in the index.
4. Source: ISI Evercore Macro Views, 7 April 2019.
5. Source: Credit Suisse Global Equity Strategy, 27 February 2019.
6. Source: Research Affiliates LLC, based on data from Robert Shiller database and Federal Reserve Economic Data (FRED), as at 31 December 2018.
7. The MSCI All Country World Index (ACWI) captures large- and mid-cap representation across 23 developed and 24 emerging market countries. Indices are unmanaged and one cannot directly invest in them. They do not include fees, expenses or sales charges. MSCI makes no warranties and shall have no liability with respect to any MSCI data reproduced herein. No further redistribution or use is permitted. This report is not prepared or endorsed by MSCI. See www.franklintempleton.com for additional data provider information.
Copyright © Franklin Templeton Investments


